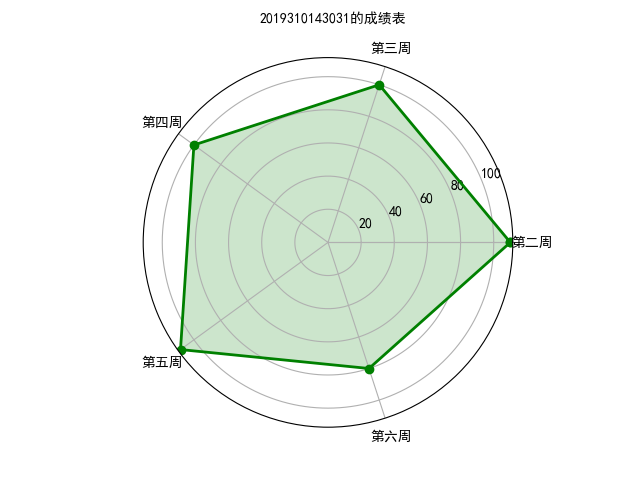
 1 import numpy as np
 2 import matplotlib.pyplot as plt
 3 import matplotlib
 4 matplotlib.rcParams['font.family']='SimHei'
 5 matplotlib.rcParams['font.sans-serif']=['SimHei']
 6 labels=np.array(['第二周','第三周','第四周','第五周','第六周'])
 7 nAttr=5
 8 Python=np.array([110,100,100,110,80])
 9 angles=np.linspace(0,2*np.pi,nAttr,endpoint=False)
10 Python=np.concatenate((Python,[Python[0]]))
11 angles=np.concatenate((angles,[angles[0]]))
12 fig=plt.figure(facecolor="white")
13 plt.subplot(111,polar=True)
14 plt.plot(angles,Python,'bo-',color='g',linewidth=2)
15 plt.fill(angles,Python,facecolor='g',alpha=0.2)
16 plt.thetagrids(angles*180/np.pi,labels)
17 plt.figtext(0.52,0.95,'2019310143031的成绩表',ha='center')
18 plt.grid(True)
19 plt.savefig('litchi.JPG')
20 plt.show()