一、编写监控kafka的topic,每秒会话次数,超过一个特定值,即触发报警
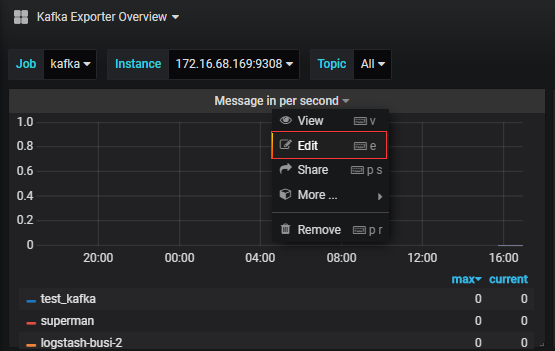
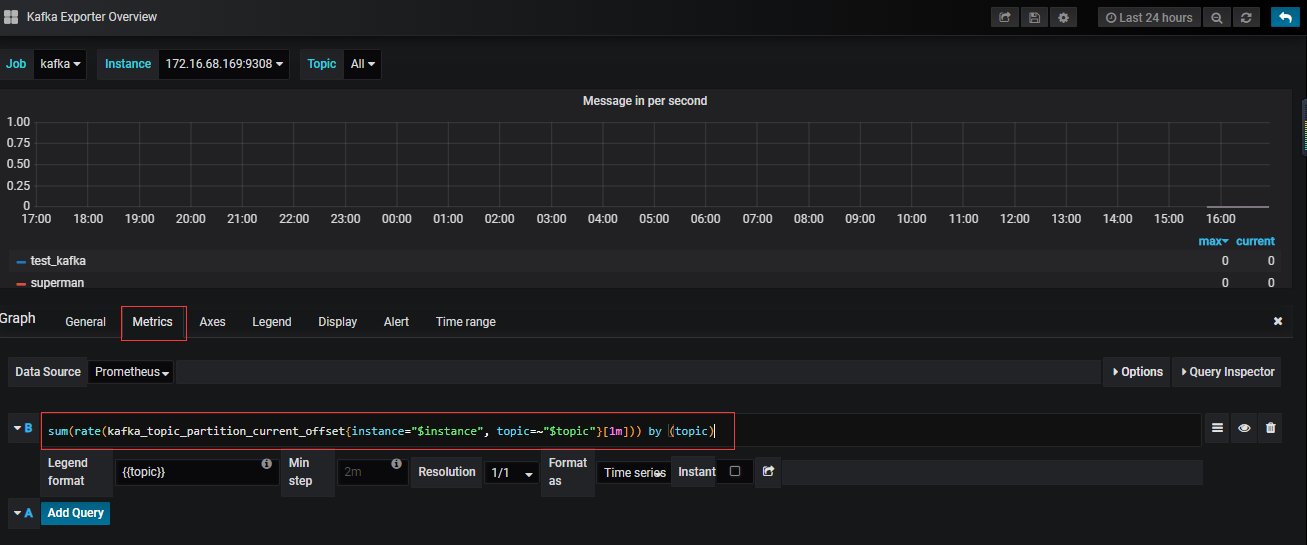
1、根据grafana仪表盘监控,可查看具体监控指标
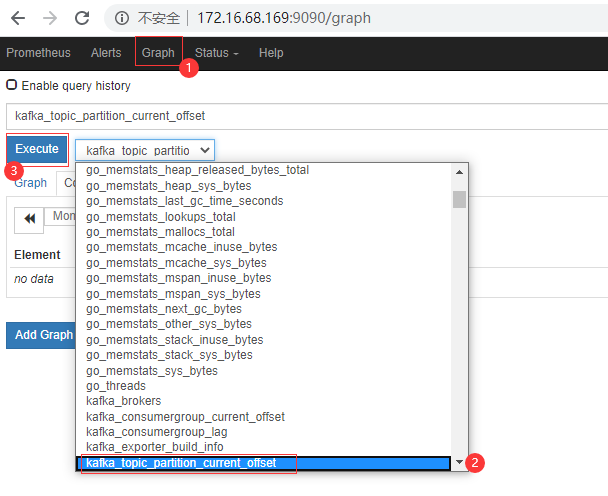
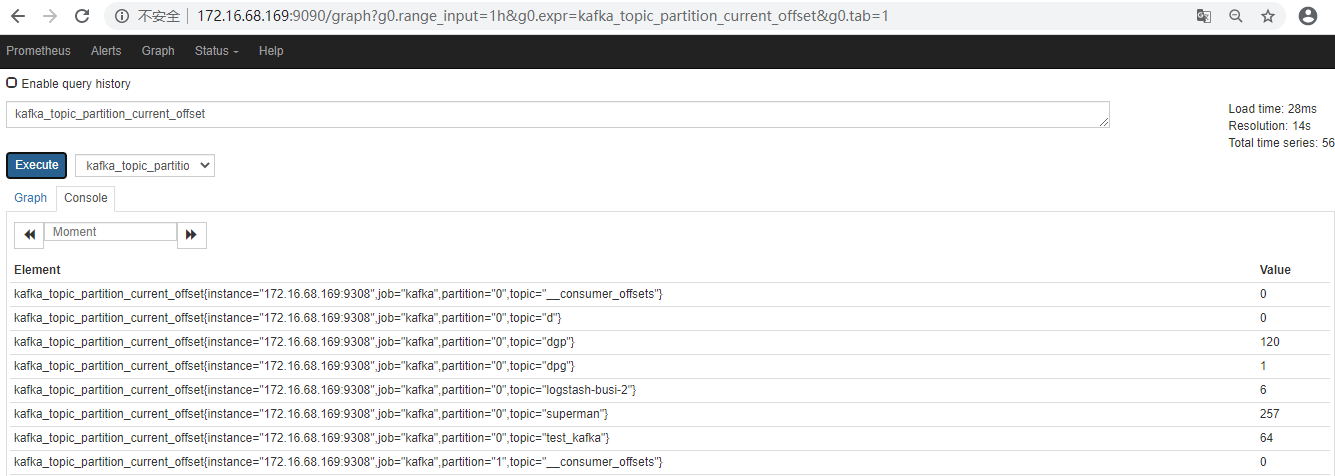
2、可在prometheus监控页面找到抓取的实时数据
3、根据prometheus抓取的数据编写报警规则文件
# pwd
/usr/local/prometheus-2.6.1.linux-amd64
# mkdir rules
# cat  rules/kafka.yml
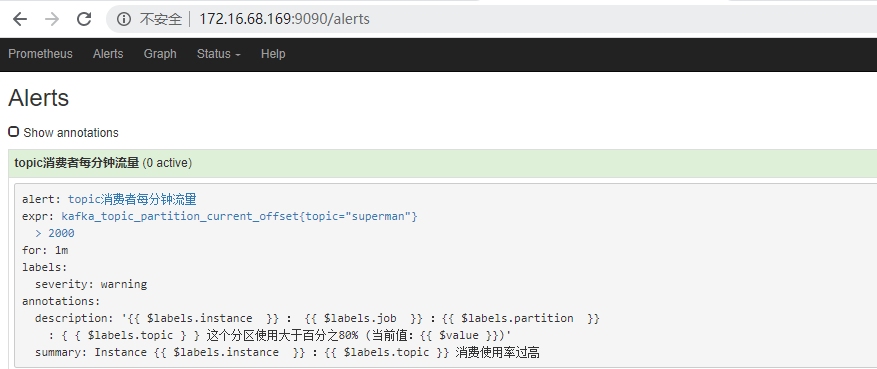
groups:
- name: kafka.rules
  rules:
  - alert: topic消费者每分钟流量
    expr: kafka_topic_partition_current_offset{topic="superman"} > 2000
    for: 1m
    labels:
      severity: warning
    annotations:
      summary: "Instance {{ $labels.instance  }} :{{ $labels.topic }} 消费使用率过高"
      description: "{{ $labels.instance  }} : {{ $labels.job  }} :{{ $labels.partition  }} : { { $labels.topic } } 这个分区使用大于百分之80% (当前值:{{ $value }})"
4、修改prometheus.yml配置文件
# cat prometheus.yml
# Load rules once and periodically evaluate them according to the global 'evaluation_interval'.
rule_files:
    - "rules/*.yml"
  # - "first_rules.yml"
  # - "second_rules.yml"
重启prometheus
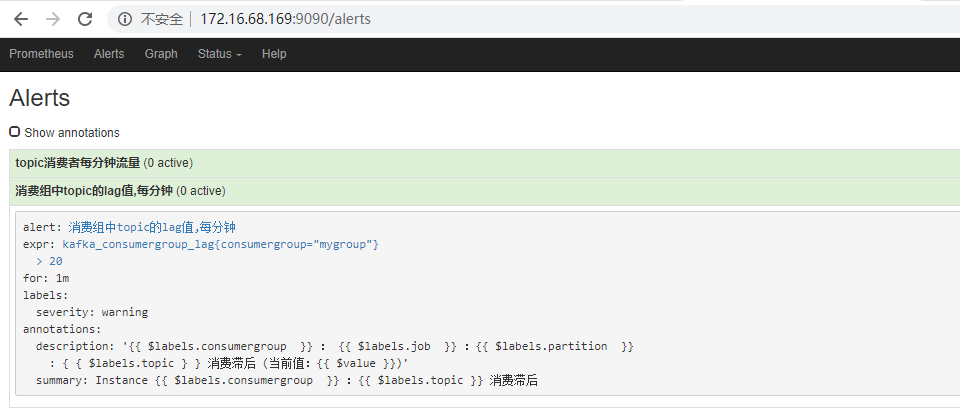
6、查看prometheus页面Alerts
二、编写监控kafka某个会话组,topic的lag超过特定值,就触发报警(步骤同上)
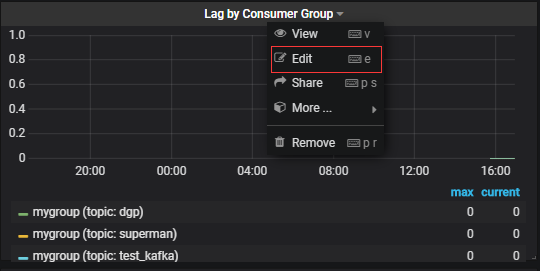
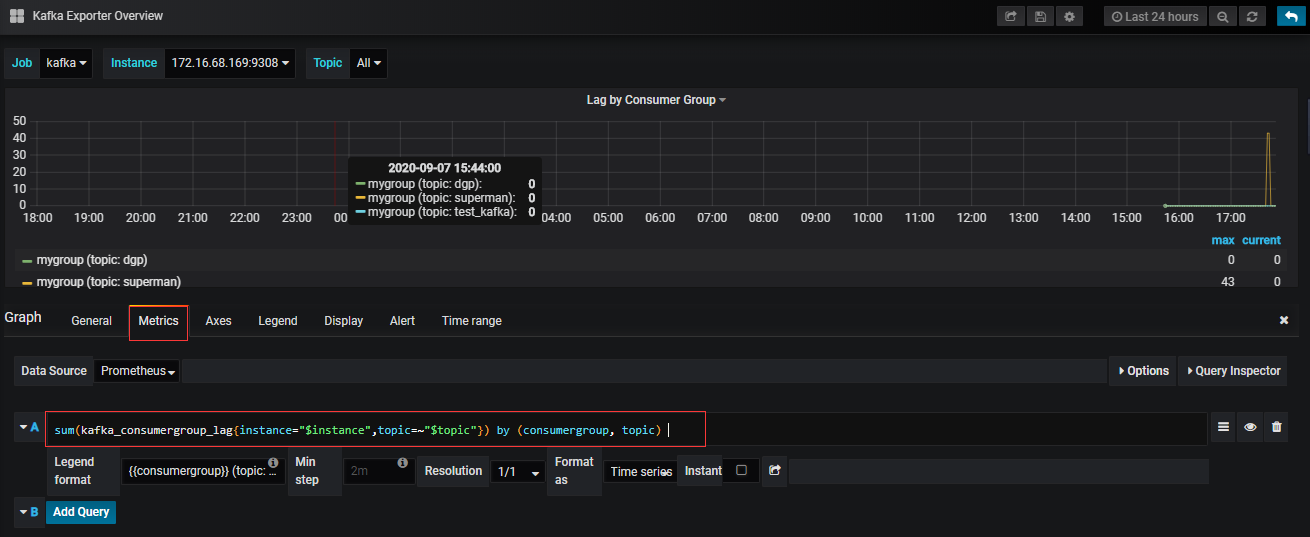
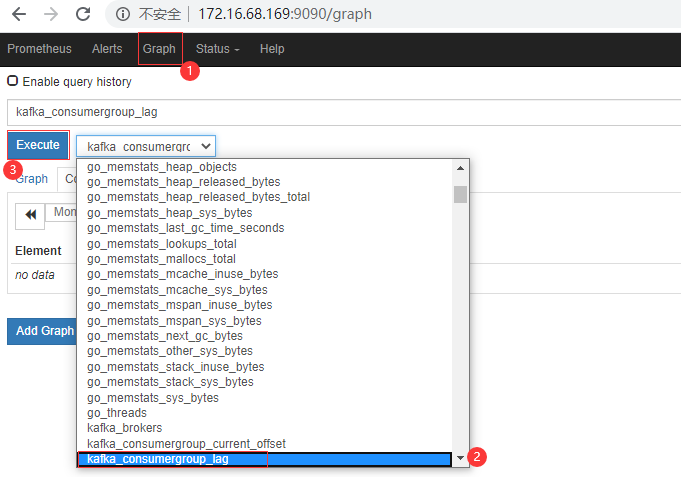
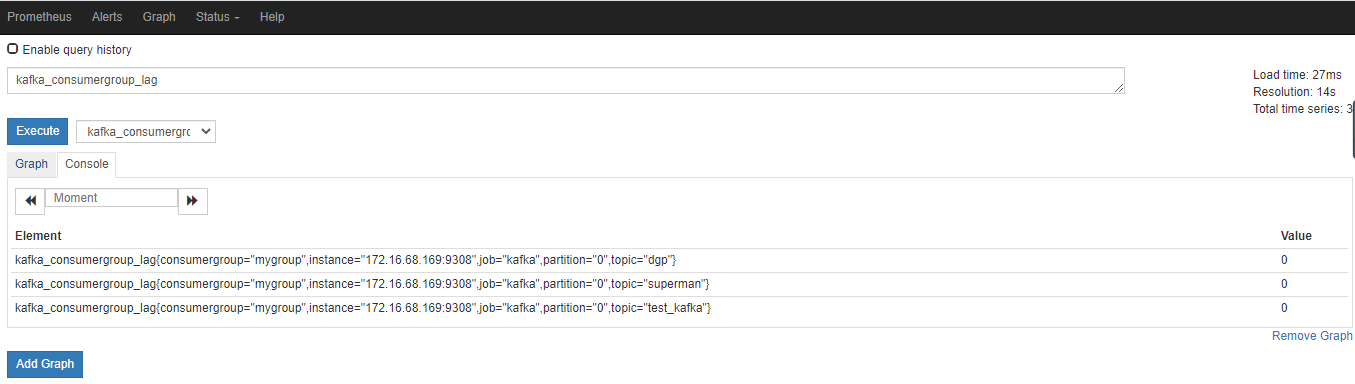
根据上述信息编写报警配置
# cd /usr/local/prometheus-2.6.1.linux-amd64/rules/
# cat kafka_lag.yml
groups:
- name: kafka_rules
  rules:
  - alert: 消费组中topic的lag值,每分钟
    expr: kafka_consumergroup_lag{consumergroup="mygroup"} > 20
    for: 1m
    labels:
      severity: warning
    annotations:
      summary: "Instance {{ $labels.consumergroup  }} :{{ $labels.topic }} 消费滞后"
      description: "{{ $labels.consumergroup  }} : {{ $labels.job  }} :{{ $labels.partition  }} : { { $labels.topic } } 消费滞后 (当前值:{{ $value }})"
重启prometheus