一、在kafka服务器上安装kafka_exporter
注:1个kafka集群只需要1个exporter,在集群上的任意1台服务器部署。
1、 下载包地址:https://github.com/danielqsj/kafka_exporter/releases/download/v1.2.0/kafka_exporter-1.2.0.linux-amd64.tar.gz
2、安装kafka_exporter
# tar zxf  kafka_exporter-1.2.0.linux-amd64.tar.gz -C /usr/local/
# cd /usr/local/kafka_exporter-1.2.0.linux-amd64/
3、启动kafka_exporter
# nohup ./kafka_exporter --kafka.server 172.16.68.169:9092 &
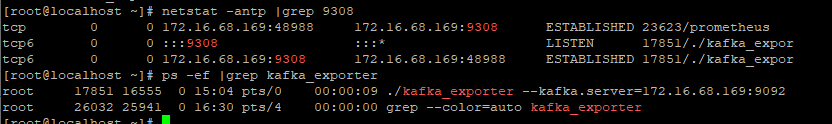
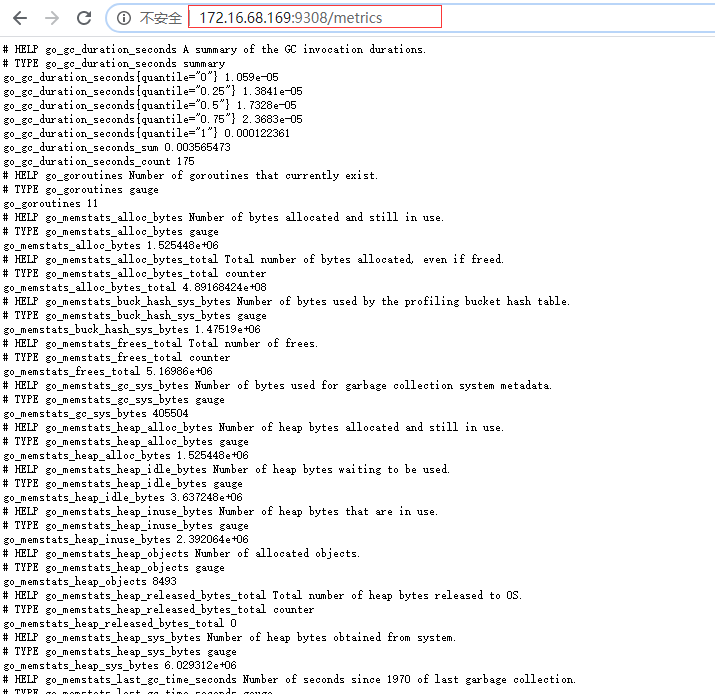
4、浏览器输入http://172.16.68.169:9308/metrics,可看到kafka_exporter抓取的监控指标。
二、编辑prometheus配置文件
# cat prometheus.yml #在文档末尾添加一下内容,注意格式
- job_name: 'kafka'
    static_configs:
    - targets: ['172.16.68.169:9308']    #配置kafka监控
配置文件语法检测
# ./promtool check config prometheus.yml

Checking prometheus.yml
  SUCCESS: 2 rule files found

Checking rules/kafka.yml
  SUCCESS: 1 rules found

Checking rules/kafka_lag.yml
  SUCCESS: 1 rules found
重启prometheus
# systemctl restart prometheus.service
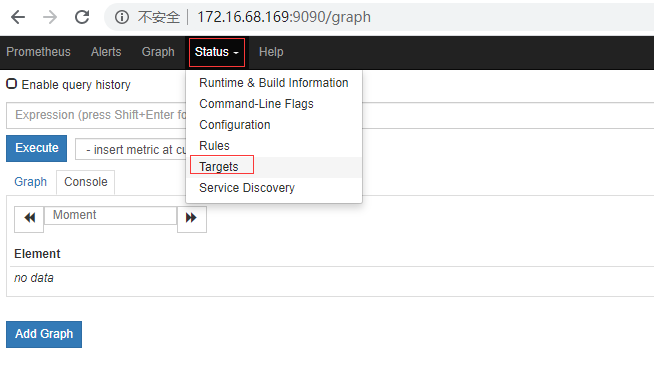
三、打开浏览器输入http://172.16.68.169:9090/
Status--->Targets,可看到kafka监控已经UP了。

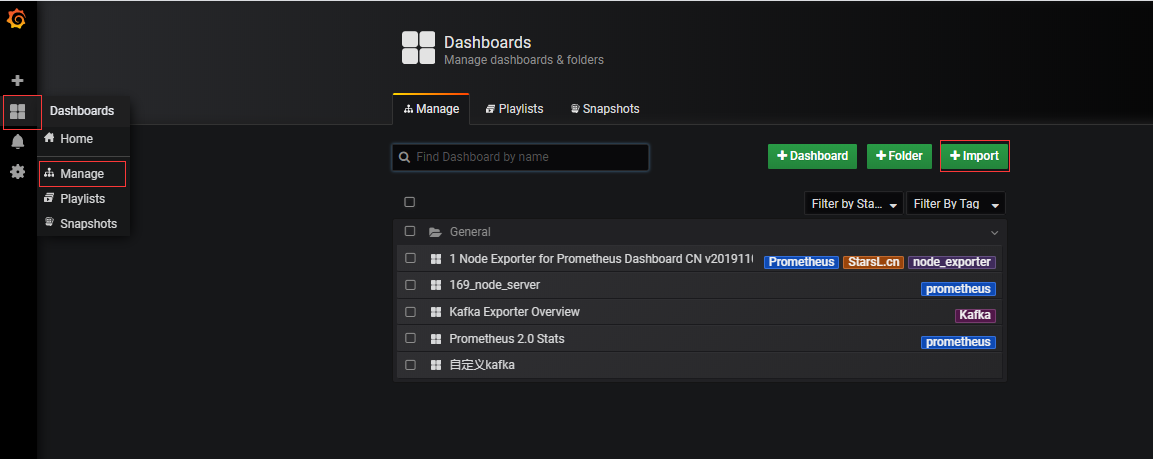
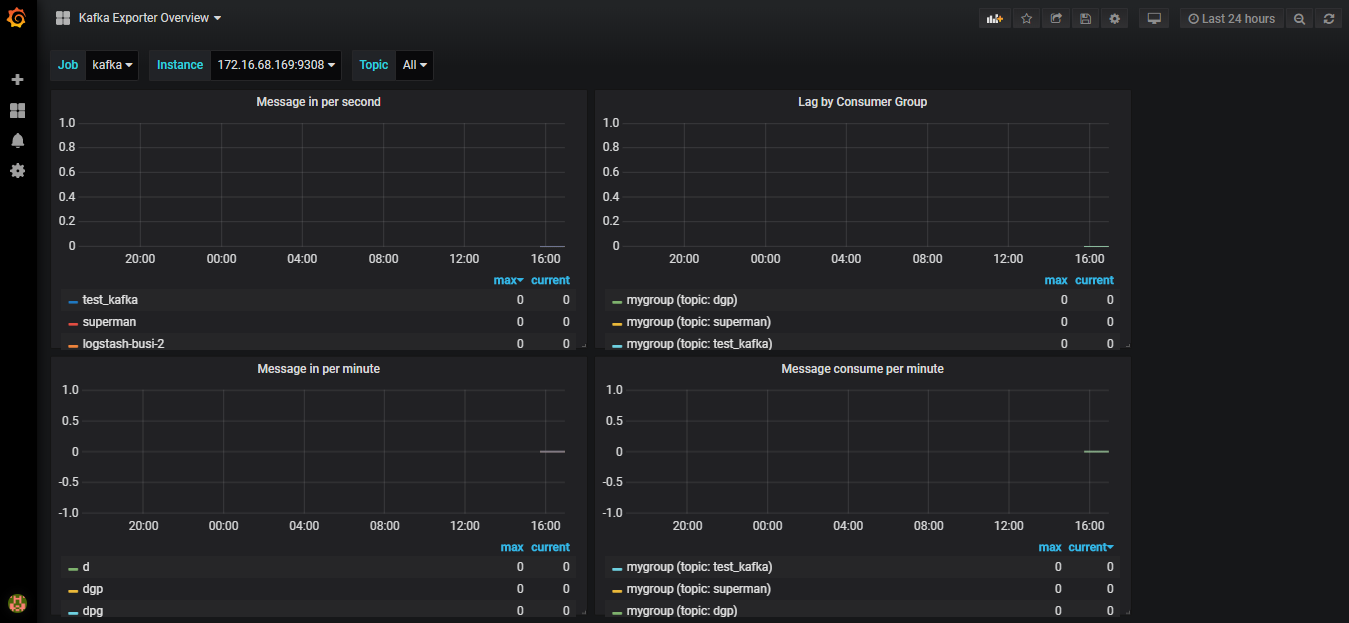
四、grafana导入引导盘
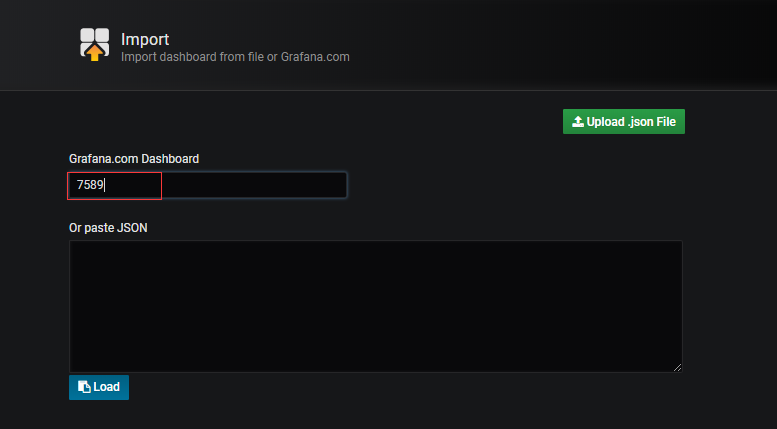
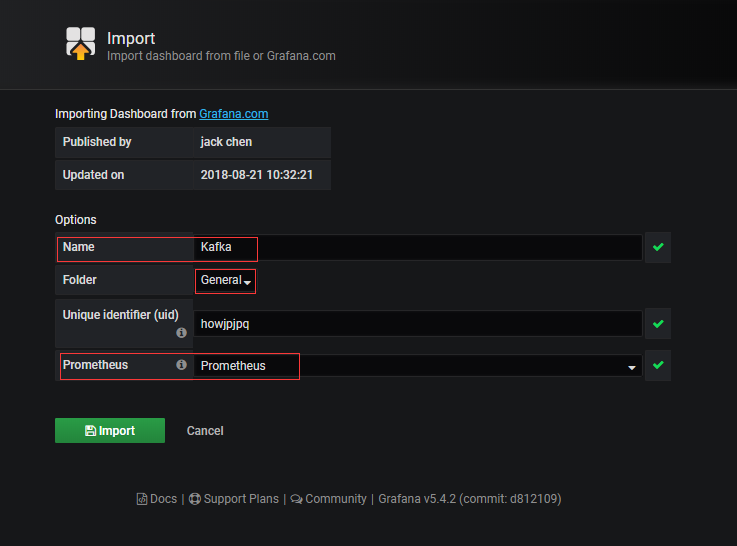
-
Grafana仪表盘参考: