1、需求
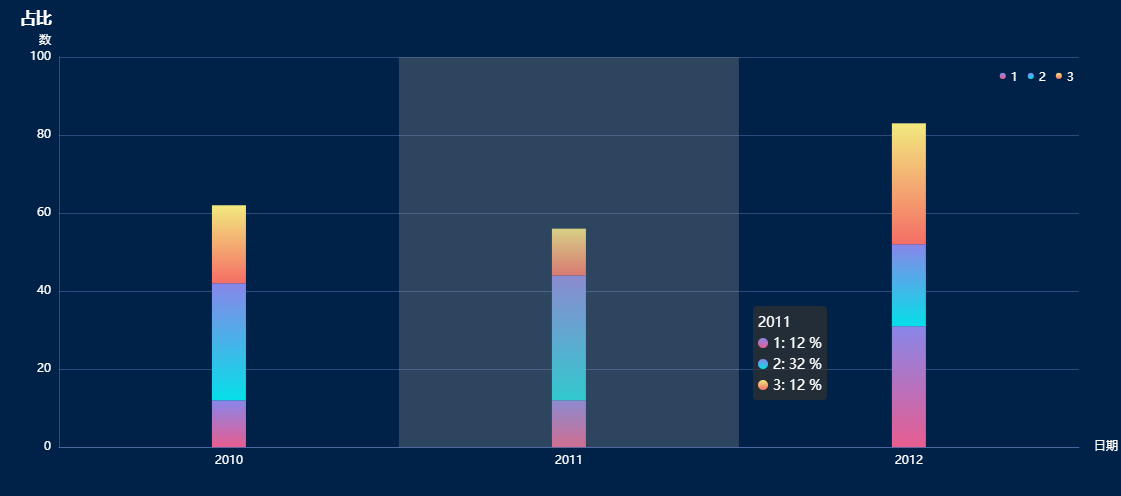
2、实现效果
3、重点代码
3.1、彩色柱状图(渐变)
var colors2 = [
    ['#8886E9', '#E75D90'],
    ['#8886E9', '#06DFE8'],
    ['#F2E97E', '#F56E65'],
    ['#70B7FE', '#0882DD']
]; //渐变色值
for (var i = 0; i < data.legend.length; i++) {
    option.series.push({
        name: data.legend[i],
        type: 'bar',
        stack: '总量',
        barWidth: '10%', //柱子的宽度
        label: {
            show: false,
            position: 'insideRight'
        },
        itemStyle: {
            normal: {
                color: new echarts.graphic.LinearGradient(0, 0, 0, 1, [{
                    offset: 0,
                    color: colors2[i % colors2.length][0]
                }, {
                    offset: 1,
                    color: colors2[i % colors2.length][1]
                }]),
            }

        },
        data: data.data[i]
    })
}
3.2、自定义鼠标移入小圈颜色(tooltip中的formatter)
formatter(v) {
  let res = `${v[0].name}<br/>`;
  v.forEach((value, index) => {
     var a = `<span style='display:inline-block;margin-right:5px;border-radius:10px;10px;height:10px;background-image:linear-gradient(${value.color.colorStops[0].color}, ${value.color.colorStops[1].color});'></span>`
     res += `${a}${v[index].seriesName}: ${v[index].value} %<br>`
  })
  return res
}
3.3、鼠标移入后提示框显示不全问题(tooltip中的position)
position: function (point, params, dom, rect, size) {
  // 鼠标坐标和提示框位置的参考坐标系是:以外层div的左上角那一点为原点,x轴向右,y轴向下
  // 提示框位置
  var x = 0; // x坐标位置
  var y = 0; // y坐标位置
  // 当前鼠标位置
  var pointX = point[0];
  var pointY = point[1];
  // 外层div大小
  // var viewWidth = size.viewSize[0];
  // var viewHeight = size.viewSize[1];
  // 提示框大小
  var boxWidth = size.contentSize[0];
  var boxHeight = size.contentSize[1];
  // boxWidth > pointX 说明鼠标左边放不下提示框
  if (boxWidth > pointX) {
     x = 5;
  } else { // 左边放的下
    x = pointX - boxWidth;
  }
  // boxHeight > pointY 说明鼠标上边放不下提示框
  if (boxHeight > pointY) {
    y = 5;
  } else { // 上边放得下
    y = pointY - boxHeight;
  }
  return [x, y];
}						},
3.4、渲染到页面中
var myChart = echarts.init(document.getElementById("div"));
myChart.setOption(option);
4、完整代码
//var myChart = echarts.init(document.getElementById("div"));

var data = {
    area: ['2010', '2011', '2012'],
    legend: ['1', '2', '3'],
    data: [
        [12, 12, 31, 34, 10],
        [30, 32, 21, 34, 30],
        [20, 12, 31, 34, 20],
    ]
}
var colors = ['#4C98FB', '#83CCE7', '#26C7C8', '#73DEBD']
var option = {
    title: {
        text: '占比',
        left: 19,
        top: 10,
        textStyle: {
            color: '#fff',
            fontSize: 16
        }
    },
    tooltip: {
        trigger: 'axis',
        axisPointer: { // 坐标轴指示器,坐标轴触发有效
            type: 'shadow' // 默认为直线,可选为:'line' | 'shadow'
        },
        formatter(v) {
            let res = `${v[0].name}<br/>`;
            v.forEach((value, index) => {
                console.log(value)
                var a = `<span style='display:inline-block;margin-right:5px;border-radius:10px;10px;height:10px;background-image:linear-gradient(${value.color.colorStops[0].color}, ${value.color.colorStops[1].color});'></span>`
                res += `${a}${v[index].seriesName}: ${v[index].value} %<br>`
            })
            return res
        }
    },
    color: colors,
    legend: {
        icon: "circle",
        right: "4%",
        top: "13%",
        itemWidth: 6,
        itemHeight: 6,
        textStyle: {
            fontSize: 12,
            color: '#fff',
            padding: [3, 0, 0, 0]
        },
        data: data.legend
    },
    backgroundColor: "#012248",
    grid: {
        left: '3%',
        right: '4%',
        bottom: '8%',
        containLabel: true
    },
    xAxis: {
        name: '日期 ',
        nameTextStyle: {
            color: '#fff'
        },
        type: 'category',
        axisLabel: {
            color: '#fff',
            show: true,
        },
        axisLine: {
            lineStyle: {
                color: 'rgba(150, 164, 244, 0.3)'
            },
             5
        },
        axisTick: {
            show: false,
        },
        data: data.area
    },
    yAxis: {
        name: '数',
        nameTextStyle: {
            color: '#fff',
            align: "right",
            padding: [0, 8, -5, 0],
        },
        type: 'value',
        axisLabel: {
            color: '#fff'
        },
        axisLine: {
            show: true,
            lineStyle: {
                color: '#color'
            },
             5
        },
        axisTick: {
            show: false,
        },
        splitLine: {
            lineStyle: {
                color: 'rgba(150, 164, 244, 0.3)'
            }
        },
    },
    series: []
};
var colors2 = [
    ['#8886E9', '#E75D90'],
    ['#8886E9', '#06DFE8'],
    ['#F2E97E', '#F56E65'],
    ['#70B7FE', '#0882DD']
]; //渐变色值
for (var i = 0; i < data.legend.length; i++) {
    option.series.push({
        name: data.legend[i],
        type: 'bar',
        stack: '总量',
        barWidth: '10%', //柱子的宽度
        label: {
            show: false,
            position: 'insideRight'
        },
        itemStyle: {
            normal: {
                color: new echarts.graphic.LinearGradient(0, 0, 0, 1, [{
                    offset: 0,
                    color: colors2[i % colors2.length][0]
                }, {
                    offset: 1,
                    color: colors2[i % colors2.length][1]
                }]),
            }

        },
        data: data.data[i]
    })
}
//myChart.setOption(option);
5、注意
如果柱子颜色不是渐变的,tooltip中可以不用加formatter,小圈会根据柱子的颜色进行展示
如果柱子颜色是渐变的,但是没有设置tooltip下的formatter的情况下,小圈颜色会显示默认颜色
声明:此博客为个人学习之用,如与其他作品雷同,纯属巧合,并请明示指出