<template>
<div>
<div id="Echart_chartId"></div>
</div>
</template>
<script>
export default {
name: 'Echart',
data () {
return {
xdata: [],
ydata: []
}
},
mounted () {
this.getDats()
this.initChart()
},
methods: {
getDats () {
const xdata = []
const ydata = []
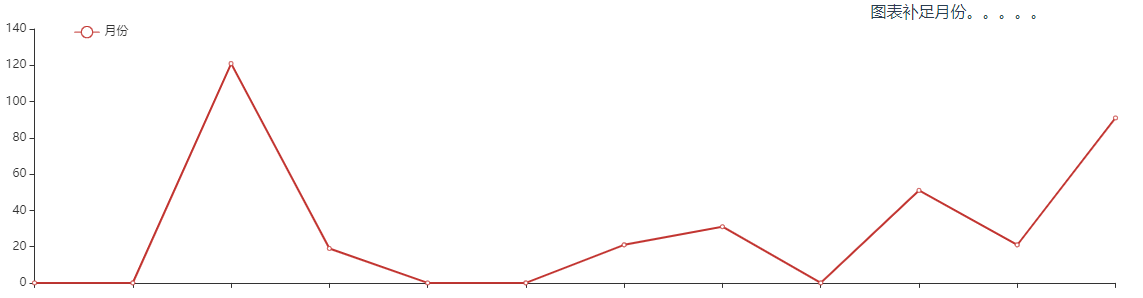
const monthas = [
{'val': 121, 'month': 3},
{'val': 19, 'month': 4},
{'val': 21, 'month': 7},
{'val': 31, 'month': 8},
{'val': 51, 'month': 10},
{'val': 21, 'month': 11},
{'val': 91, 'month': 12}
]
const monthMap = []
monthas.forEach(item => {
const cur = item.month
monthMap[cur] = item
})
for (let i = 1; i < 13; i++) {
let month = '' + i
if (i < 10) {
month = '0' + i
}
xdata.push(month)
const val = monthMap[i]
if (val) {
ydata.push(val.val)
} else {
ydata.push(0)
}
}
this.xdata = xdata
this.ydata = ydata
},
initChart () {
const chart = this.$echarts.init(document.getElementById('Echart_chartId')) // 我全局引入的echarts
chart.setOption({
tooltip: {
trigger: 'axis',
axisPointer: {
type: 'cross'
}
},
legend: {
data: [ '月份' ],
left: '6%'
},
grid: {
left: '3%',
right: '3%',
top: '3%',
bottom: '3%'
},
xAxis: {
type: 'category',
data: this.xdata,
splitLine: {
show: false
},
boundaryGap: false
},
yAxis: {
type: 'value',
splitLine: {
show: false
},
},
series: [
{
type: 'line',
name: '月份',
data: this.ydata
}
]
})
}
}
}
</script>
<style scoped>
#Echart_chartId{
height: 270px;
60%;
}
</style>