preface
我们每天都要查看服务器的日志,一方面是为了开发的同事翻找日志,另一方面是巡检服务器查看日志,而随着服务器数量以及越来越多的业务上线,日志越来越多,人肉运维相当痛苦了,此时,参考现在非常流行的日志分析工具,搭建了一套ELK日志分析系统。下面就说说ELK,ELK安装过程以及如何使用。
了解它
ELK全称其实三个软件组合而成的,ElasticSearch + Logstash + Kibana。
- logstash负责收集日志的。
- elasticsearch用来存储和搜索日志的。
- kibana用来web界面显示日志的。
所以ELK指定就是上面三个软件的缩写。企业通用的架构图如下:
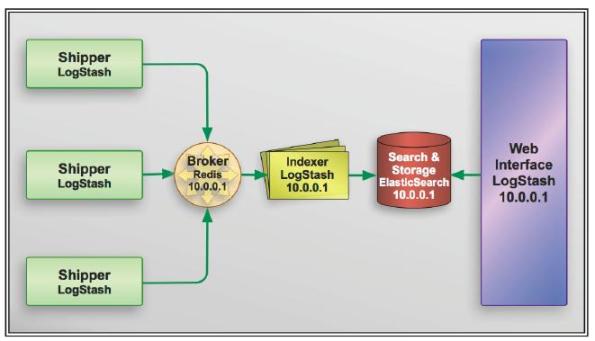
我们这套架构讲究了松耦合关系和缓冲关系,logstash与elasticsearch中间加了个redis,避免当elasticsearch宕机后,logstash的日志便会无法写入日志,容易导致日志丢失。同时也起到一个缓冲的作用,避免日志量过大导致elasticsearch服务器扛不住。
废话不多说,我们现在就开始开工吧。
安装它
我们采用简单的yum形式安装,由于elasticsearch和logstash是java开发的,所以需要安装java的环境。
| ip | hostname | 角色 |
|---|---|---|
| 192.168.141.3 | linux-node1 | es+k+log |
| 192.168.141.4 | linux-node2 | es+log |
- 以上系统都是CentOs6.6系统。
- hostname和hosts文件解析必须一一对应。
- max_open_file必须改掉,改为65535。
- 各个服务器关闭selinux,iptables,以及NTP同步。
安装java环境
node1和node2同时操作安装java:
[root@linux-node1 ~]# yum -y install java
[root@linux-node1 ~]# java -version
openjdk version "1.8.0_111"
安装elasticsearch
可以参考官网的安装手册:https://www.elastic.co/guide/en/elasticsearch/reference/2.4/_installation.html
[root@linux-node1 ~]# rpm --import https://packages.elastic.co/GPG-KEY-elasticsearch  # 首先安装yum源的公钥。
[root@linux-node1 ~]# cat /etc/yum.repos.d/elasticsearch.repo
[elasticsearch]
name=Elasticsearch
baseurl=http://packages.elastic.co/elasticsearch/2.x/centos
gpgcheck=1
gpgkey=http://packages.elastic.co/GPG-KEY-elasticsearch
enabled=1

[root@linux-node1 ~]# yum -y install -y elasticsearch
安装logstash
[root@linux-node1 ~]# rpm --import https://packages.elastic.co/GPG-KEY-elasticsearch
[root@linux-node1 ~]# cat /etc/yum.repos.d/logstash.repo
[logstash-2.3]
name=Logstash repository for 2.3.x packages
baseurl=https://packages.elastic.co/logstash/2.3/centos
gpgcheck=1
gpgkey=https://packages.elastic.co/GPG-KEY-elasticsearch
enabled=1


[root@linux-node1 ~]# yum -y install logstash
安装kibana
Kibana 是为 Elasticsearch 设计的开源分析和可视化平台。可以使用 Kibana 来搜索,查看存储在 Elasticsearch 索引中的数据并与之交互。可以很容易实现高级的数据分析和可视化,以图表的形式展现出来。
[root@linux-node1 ~]# rpm --import https://packages.elastic.co/GPG-KEY-elasticsearch
[root@linux-node1 ~]# cat /etc/yum.repos.d/kibana.repo
[kibana-4.5]
name=Kibana repository for 4.5.x packages
baseurl=http://packages.elastic.co/kibana/4.5/centos
gpgcheck=1
gpgkey=http://packages.elastic.co/GPG-KEY-elasticsearch
enabled=1

[root@linux-node1 ~]# yum -y install kibana
配置他们
我们通过yum安装了elk,下面就开始配置他们。
配置elasticsearch
先看看配置文件:
[root@linux-node1 ~]# rpm -ql elasticsearch
/etc/elasticsearch
/etc/elasticsearch/elasticsearch.yml   # 主配置文件
.....

[root@linux-node1 ~]# cd /etc/elasticsearch/
[root@linux-node1 elasticsearch]# ls
elasticsearch.yml  logging.yml  scripts
[root@linux-node1 bin]# grep -v ^# /etc/elasticsearch/elasticsearch.yml
cluster.name: myes      # 集群名字
node.name: linux-node1    # 节点名字
path.data: /data/es-data/
path.logs: /var/log/elasticsearch
bootstrap.memory_lock: true   # 是否锁定内存
network.host: 192.168.141.3
http.port: 9200
discovery.zen.ping.unicast.hosts: ["192.168.141.3", "192.168.141.4"]    #广播方式,用来发现同一个集群下的节点,这里写的是单播 加上去,这样方便双方互相认识。

[root@linux-node1 ~]# grep elas /etc/passwd
elasticsearch:x:496:491:elasticsearch user:/home/elasticsearch:/sbin/nologin
[root@linux-node1 ~]# mkdir /data/es-data/  -p
[root@linux-node1 ~]# chown -R elasticsearch.  /data/es-data/    # 因为使用elkstaticsearch用户启动的,所以必须为这个用户授权给data目录
[root@linux-node1 ~]# /etc/init.d/elasticsearch start
正在启动 elasticsearch:                                   [确定]
这里说下elasticsearch的加入集群的模式。我们发现在配置文件里有这2行,组播和单播模式:
# Pass an initial list of hosts to perform discovery when new node is started:
discovery.zen.ping.unicast.hosts: ["host1", "host2"]     # 单播的形式
# Prevent the "split brain" by configuring the majority of nodes (total number of nodes / 2 + 1):
discovery.zen.minimum_master_nodes: 3     # 组播形式,数量是总数量除以2后加1
elkstaticsearch 模块的使用
[root@linux-node1 ~]# curl -i XGET "http://192.168.141.3:9200/_count?"   #统计当前的信息
HTTP/1.1 200 OK
Content-Type: application/json; charset=UTF-8
Content-Length: 59

{"count":0,"_shards":{"total":0,"successful":0,"failed":0}}
安装其他模块:
[root@linux-node1 elasticsearch]# /usr/share/elasticsearch/bin/plugin install  mobz/elasticsearch-head
[root@linux-node1 elasticsearch]# /usr/share/elasticsearch/bin/plugin   install --verbose lmenezes/elasticsearch-kopf    # 安装这个模块
然后我们访问这个模块
在浏览器输入http://192.168.141.3:9200/_plugin/head/就可以看到这个主节点的信息了。
当一台主分片服务器宕机后,主节点认定为故障后,那么这宕机的服务器信息分片就丢失了,此时主节点先去判断这个宕机节点丢失了哪些信息,然后从剩余的副节点服务器中选举一个当作主分片服务器,再把这台刚选举出来的主分片服务器复制给信息其他的副分片节点。比如副本节点3台服务器,那么选举一台为主分片服务器后,就copy 2份到其他副本节点服务器。
当进行数据查询的时候,比如我们当前连接到192.168.141.4上,我们查询的数据不在192.168.141.4上,而是在192.168.141.3上,那么192.168.141.4服务器就会去从其他服务器获取信息后汇总到自身,然后返回给你。In short,就是你连接上了哪台服务器,就会对你负责。
在访问head模块首页的时候,我们发发现概览里面的节点信息,字体是黑粗体那就是主分片,细的为备份分片,在一般情况下,主副分片不在同一台服务器上。我们再看节点名称的右边的颜色,黄色表示警告,绿色表示健康,红色表示不健康,可能有分片丢失。

我们还可以使用刚才安装的kopf模块浏览器输入http://192.168.141.137:9200/_plugin/kopf/#!/rest
添加elasticsearch集群:
所有节点通过集群名字来判断是否同一个集群的,所有集群中,都会进行选取一个主节点,那就是master节点,主节点负责管理集群的状态,那什么是负责管理 集群的状态呢?比如说数据块分片,分片的数量以及主副分片都是由主节点决定的。
从用户的角度来看,我们不需要关心哪个是主节点,只需要连接就可以了,因为所有操作都是由elasticsearch完成的。我们需要查询数据不需要经过主节点进行转发,写入数据也一样,直接写入node2上,然后node2再copy到其他节点上。
我们在开启一台虚拟机,然后安装上elasticsearch,配置文件从我们第一台elasticsearch复制过去,然后修改部分内容:
确保node2节点也有java环境
[root@linux-node2 elasticsearch]# chown -R elasticsearch.elasticsearch /data/es-data/
[root@linux-node2 elasticsearch]# mkdir -p /data/es-data
[root@linux-node2 ~]# grep -v ^# /etc/elasticsearch/elasticsearch.yml
cluster.name: myes      # 集群名字
node.name: linux-node2    # 节点名字
path.data: /data/es-data/
path.logs: /var/log/elasticsearch
bootstrap.memory_lock: true   # 是否锁定内存
network.host: 192.168.141.4
http.port: 9200
discovery.zen.ping.unicast.hosts: ["192.168.141.3", "192.168.141.4"]     # 把同一集群的服务器IP写到这里,方便他们互相认识。
启动服务:
[root@localhost elasticsearch]# service elasticsearch start
正在启动 elasticsearch:                                   [确定]
然后我们再次访问head模块:
http://192.168.141.3:9200/_plugin/head/ 发现有2个node。
获取集群监控状态:
关于集群监控状态的,我们可以查看官网的集群API:https://www.elastic.co/guide/en/elasticsearch/reference/2.4/cluster-health.html#request-params
[root@sql1 elasticsearch]# curl -XGET 'http://192.168.141.3:9200/_cluster/health?pretty=true'
{
  "cluster_name" : "myes",
  "status" : "green",
  "timed_out" : false,
  "number_of_nodes" : 2,
  "number_of_data_nodes" : 2,
  "active_primary_shards" : 5,
  "active_shards" : 10,
  "relocating_shards" : 0,
  "initializing_shards" : 0,
  "unassigned_shards" : 0,
  "delayed_unassigned_shards" : 0,
  "number_of_pending_tasks" : 0,
  "number_of_in_flight_fetch" : 0,
  "task_max_waiting_in_queue_millis" : 0,
  "active_shards_percent_as_number" : 100.0
}
更多模块请参考:
https://www.elastic.co/guide/en/elasticsearch/guide/current/_cat_api.html
接下来介绍logstash
logstash有input和output,从input进入的数据然后从output出来,同时可对这个数据流进行filter。如下图所示:

更多资料,参考官网:https://www.elastic.co/guide/en/logstash/2.3/advanced-pipeline.html
拿个命令简单说下:
采用yum安装,默认的路径在/opt/logstash/。logstash命令就在/opt/logstash/bin/logstash
[root@linux-node1 bin]# ./logstash -e "input { stdin{} } output { stdout{} }"   # 这个命令执行毕竟长,因为在等待jvm的启动。

Settings: Default pipeline workers: 2
Pipeline main started
2016-09-04T11:51:40.968Z sql1.com hello   # 输入什么回复什么,同时加上时间戳
how are you
2016-09-04T11:51:49.579Z sql1.com how are you
来一个rbuby格式的内容,先说下在logstash里面=>表示等号。
[root@linux-node1 bin]# ./logstash -e "input { stdin{} } output { stdout{ codec => rubydebug} }"
Settings: Default pipeline workers: 2
Pipeline main started
hello
{
       "message" => "hello",
      "@version" => "1",
    "@timestamp" => "2016-09-04T11:53:21.030Z",
          "host" => "sql1.com"
}
how are you
{
       "message" => "how are you",
      "@version" => "1",
    "@timestamp" => "2016-09-04T11:53:25.710Z",
          "host" => "sql1.com"
logstash写入elasticsearch
首先参考官网质料:https://www.elastic.co/guide/en/logstash/2.3/plugins-outputs-elasticsearch.html
我们通过命令行模式把logstash的内容输入到elasticsearch中。
[root@linux-node1 bin]#  ./logstash -e "input { stdin{} } output { elasticsearch { hosts => ['192.168.141.3:9200'] index => 'logstash-%{+YYYY.MM.DD}'} }"
Settings: Default pipeline workers: 2
Pipeline main started
hello
goodnight
i don't know
然后访问web流量器访问head模块:

我们简单看看logstash的配置文件,配置文件放在/etc/logstash/下面:
output{
    elasticsearch {          # 表示使用elasticsearch来作为output
        hosts => ["192.168.141.4:9200"]      #hosts表示elasticsearch的主机,因为是列表,所以使用[]号,主机要双引号括起来,因为是要字符串类型。
        index => "logstash-%{+YYYY.MM.dd}"     #索引,表示使用时间戳作为索引值。
    }
    stdout{
        codec => rubydebug
    }
}
需要说明的是,这个每一行是事件,为什么要叫做事件,因为我们可以把配置写成一行。
这个配置的流程是这样的:
事件 -> input -> codec -> filter -> codec -> output
codec的意思是编码的意思,可以指定数据格式,比如可以指定为json。
通过logstash配置文件来配置日志的输入与输出以及filter
我们先看看官网的资料:https://www.elastic.co/guide/en/logstash/2.3/plugins-inputs-file.html
我们需要注意两个参数:
| 参数名 | 作用 |
|---|---|
| type | 指定类型,自定义,方便后边output进行 if[type] 匹配 |
| start_position | 表示从哪里开始读取文件,默认是从文件结尾开始, |
| sincedb_path | 数据库文件,用来记录当前监控下的文件的位置,这样知道上回读在哪里了。这个必须是文件路径,而不是目录路径。默认是写在$HOME/.sincedb* |
| path | 指定日志文件路径,可以是数组,表示同时写入多个文件。类似于这样的格式 |
kibana
kibana是专门为elasticsearch设计的可视化平台。logstash和kibana两者没有任何关系。我们在192.168.141.3上安装它。
下面就配置下它
[root@linux-node1 ~]# grep -v ^# /opt/kibana/config/kibana.yml
server.port: 5601         # 监听的端口
elasticsearch.url: "http://192.168.141.3:9200"    # 访问elasticsearch的地址。
kibana.index: ".kibana"           # 存储索引是在elasticsearch里面,把elasticsearch作为它的数据存储介质。
下面就启动它:
[root@linux-node1 ~]# service kibana start
kibana started
查看端口是否真正存在:
[root@linux-node1 ~]# netstat -lnpt |grep 5601
tcp        0      0 0.0.0.0:5601                0.0.0.0:*                   LISTEN      31759/node     #5601已经在
接下来访问kibana,访问地址是http://192.168.141.3:5601,接下来简单的配置它:

如果没有问题,kibana匹配成功了,那么就点击 create 这个按钮,然后我们去搜索下日志:
下面这个图,右上角有个时间匹配选项,我们可以根据自己的需求来选择。

再说下怎么去控制自己想要显示的列,或者隐藏不想显示的列

logstash 用if对output进行条件匹配
我们在使用logstash-input的时候,会有多个输入源,不同的输入源对应不同的输出,那么如何保证输入源和输出是一一对应的,这个时候我们就需要使用if条件去做判断了。
从配置logstash的文件入手:
[root@linux-node1 logstash]# vim /etc/logstash/conf.d/file.conf
input{
    file {
        path => ["/var/log/messages","/var/log/secure"]
        type => "system-log"     #定义type类型,方便下面通过if去匹配判断
        start_position => "beginning"
    }
    file {
        path => "/var/log/elasticsearch/myes.log"
        type => "es-log"
    }
}

filter{
}

output{
    if [type] == "system-log"{     #通过if[type]来对input 的type类型来判断,匹配才走下面的内容
        elasticsearch {
            hosts => ["192.168.141.4:9200"]    # elasticsearch服务器地址
            index => "system-log-%{+YYYY.MM.dd}"     # 索引
        }
    }
    if [type] == "es-log" {
        elasticsearch {
            hosts => ["192.168.141.4:9200"]
            index => "es-log-%{+YYYY.MM.dd}"
        }
    }
}
[root@linux-node1 conf.d]#  /opt/logstash/bin/logstash -f /etc/logstash/conf.d/file.conf
[root@linux-node1 logstash]# service elasticsearch restart       # 最好重启elasticsearch,不然的话访问head模块显示不了我们刚刚配置的数据,我就因为没有重启所以看不到。
Stopping elasticsearch:                                    [  OK  ]
Starting elasticsearch:                                    [  OK  ]
此时我们查看http://192.168.141.3:9200/_plugin/head/,就可以看到多出一个日志了。名字为es-log。然后再在kibana里面添加这个日志。具体操作如下图所示:


这里说说kibana日志搜索的语法,如下图所示
由于网页太小了,麻烦亲们放大网页看图中我手敲的内容。

