  1 <template>
  2   <div :id="chartId" :style="{ height: box.height,  box.width }" />
  3 </template>
  4
  5 <script>
  6 import * as echarts from "echarts";
  7 import { debounce } from "../../utils/utils";
  8
  9 export default {
 10   name: "stackedAreaChart",
 11   props: {
 12     chartId: {
 13       type: String,
 14       default: "defaultChart",
 15     },
 16     chartData: {
 17       type: Object,
 18       default: () => {},
 19     },
 20     box: {
 21       type: Object,
 22       default: () => {
 23         return {  "45%", height: "100%" };
 24       },
 25     },
 26   },
 27   data() {
 28     return {
 29       chart: null,
 30     };
 31   },
 32   mounted() {
 33     window.onresize = () => {
 34       debounce(() => this.chart.resize(), 1000);
 35     };
 36     this.$nextTick(() => {
 37       this.drawChart();
 38     });
 39   },
 40   computed: {
 41     chartTitle: {
 42       get() {
 43         return this.chartData?.title;
 44       },
 45     },
 46     categoryData: {
 47       get() {
 48         return this.chartData?.categoryData;
 49       },
 50     },
 51     legendData: {
 52       get() {
 53         return (
 54           this.chartData?.items.map((item) => {
 55             return { name: item.name, icon: "roundRect" };
 56           }) ?? []
 57         );
 58       },
 59     },
 60     seriesData: {
 61       get() {
 62         return this.chartData?.items.map((item, index) => {
 63           return {
 64             name: item.name,
 65             type: "line",
 66             stack: "Total",
 67             areaStyle: {},
 68             emphasis: {
 69               focus: "series",
 70             },
 71             data: item.value,
 72           };
 73         });
 74       },
 75     },
 76   },
 77   methods: {
 78     drawChart() {
 79       if (!this.chart) {
 80         this.chart = echarts.init(document.getElementById(this.chartId));
 81       }
 82
 83       let option = {
 84         title: {
 85           text: this.chartTitle,
 86           x: "center",
 87           y: "bottom",
 88         },
 89         legend: {
 90           data: this.legendData,
 91         },
 92         grid: {
 93           left: "3%",
 94           right: "4%",
 95           bottom: "10%",
 96           containLabel: true,
 97         },
 98         tooltip: {
 99           trigger: "axis",
100           axisPointer: {
101             type: "cross",
102             label: {
103               backgroundColor: "#6a7985",
104             },
105           },
106         },
107         xAxis: [
108           {
109             type: "category",
110             boundaryGap: false,
111             data: ["Mon", "Tue", "Wed", "Thu", "Fri", "Sat", "Sun"],
112           },
113         ],
114         yAxis: [
115           {
116             type: "value",
117           },
118         ],
119         series: this.seriesData,
120       };
121
122       this.chart.on("click", (params) => {
123         console.log(params);
124       });
125       this.chart.setOption(option);
126     },
127   },
128 };
129 </script>
↑ StackedAreaChart.vue
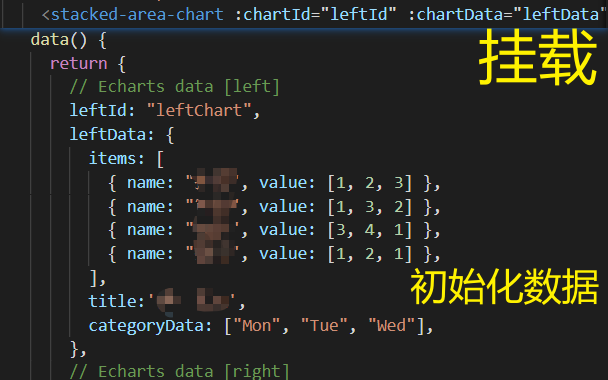
↓ 使用这个组件
PS 里面用到的debounce是这篇随笔介绍的内容~