0.相关网站
官网文档——heatmap.js Documentation (patrick-wied.at)
一个写的很好的示例——Vue+heatmap.js实现热力图的展示 - 简书 (jianshu.com)
1.安装
npm install heatmap.js
2.引用
// 在需要的文件中引入
// h337是官网用的写法,我就照着这个来了
import h337 from "heatmap.js";
3.使用


  data() {
    return {
      heapMapIns: null,
      pointsArr: [{ x: 115, y: 115, value: 1000 }],
    };
  },
  mounted() {
    window.onresize = () => {
      this.myChart.resize();
    };
    this.drawMap();

    this.initHeatMapOrigin();
  },

// Methods
    initHeatMapOrigin() {
      // create configuration object
      let config = {
        container: document.getElementById("mapTest"),
        radius: 10,
        maxOpacity: 0.5,
        minOpacity: 0,
        blur: 0.75,
        gradient: {
          // enter n keys between 0 and 1 here
          // for gradient color customization
          ".5": "blue",
          ".8": "red",
          ".95": "white",
        },
      };
      // create heatmap with configuration
      this.heapMapIns = h337.create(config);

      // a single datapoint
      let point = {
        x: 150, // x coordinate of the datapoint, number
        y: 215, // y coordinate of the datapoint, number
        value: 500, // the value at datapoint(x, y)
      };
      let dataPoint = point;
      this.heapMapIns.addData(dataPoint);

      // multiple datapoint
      // (for data initialization use setData!!)
      this.heapMapIns.addData(this.pointsArr);
    },
4.注意要点
    // DELETE HeatMap
    deleteHeatMap() {
      let data = {
        max: 100,
        min: 0,
        data: [],
      };
      this.heapMapIns.setData(data);
      console.log("Delete heatMap");
    },
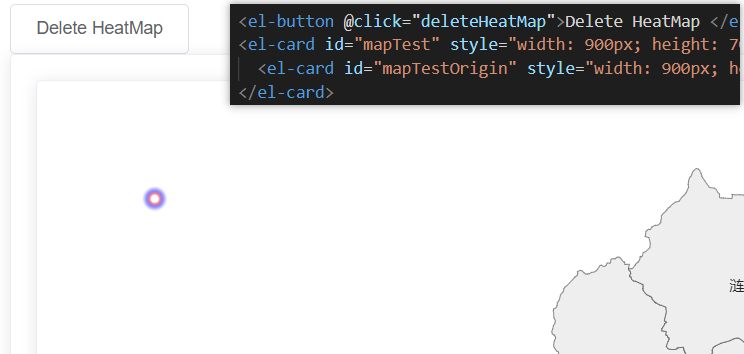
然后是关于层级的问题,一开始我犯了个错误,把地图层和热力图层作为两个同级元素,结果堆在1起总是有一个被挡住。后来就想到把热力图放在父亲层,地图放在子层,这样就可以用了。
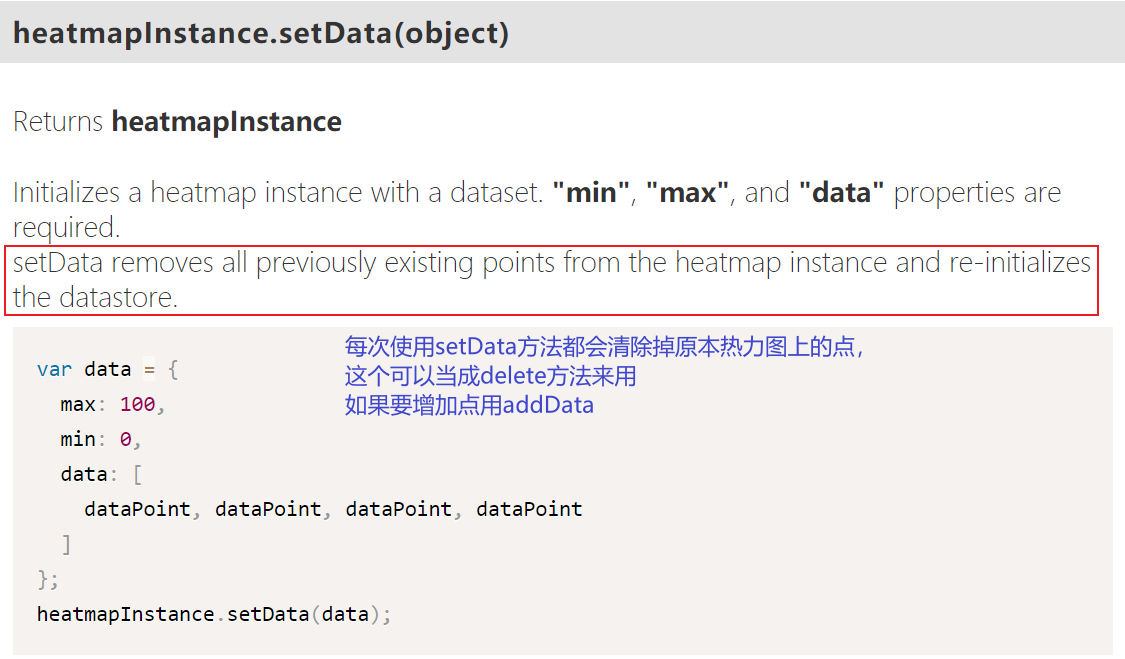
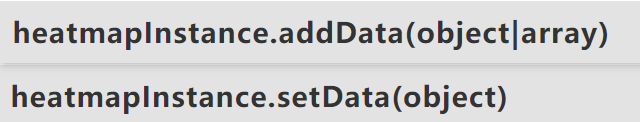
还有关于addData和setData区别,setData是初始化热力图用的,addData是后续增加点用的。两者接收参数也不同,setData只能接收对象,addData对象和数组都可以。
只要数据改动addData,就可以在图像上显示。如果设定了MAX与MIN,记得后续加点也要用setData!!!不然初次渲染的没有高度!!!
关于初始化setData时候的报错,也是上面这个原因,注意传参值。


还有关于保存初始值深浅拷贝的问题,见下一篇随笔。
5.测试项目
老规矩先上代码
<template>
  <div>
    <el-switch v-model="isShow" inactive-color="#666" active-color="#53acff">
    </el-switch>
    <el-button @click="addHeatPoints">Add Heat Points </el-button>
    <el-button @click="backDefault">Default </el-button>

    <div id="mapTest" style=" 900px; height: 700px">
      <el-card id="mapTestOrigin" style=" 900px; height: 700px"></el-card>
    </div>
  </div>
</template>

<script>
import * as echarts from "echarts";
import h337 from "heatmap.js";
// import * from "heatMap";

export default {
  data() {
    return {
      heatMapIns: null,
      // Default Setting
      pointsArrO: [],
      pointsArr: [{ x: 115, y: 115, value: 1000 }],
      isShow: true,
    };
  },
  watch: {
    isShow() {
      // When isShow is true, heatMap can be seen.
      // Otherwise, the heapPoints will remove from the map.
      if (this.isShow) {
        let dataFormatter = {
          // Max and min data compare to show the heapMap color.
          max: 1000,
          min: 0,
          data: this.pointsArr,
        };
        // this.pointsArr.forEach((key) => {
        //   console.log("VALUE", key.value);
        // });

        // A sentence is equal to B.
        // A.
        // this.heatMapIns.setData(dataFormatter);
        // B.
        this.heatMapIns.addData(this.pointsArr);
      } else {
        this.deleteHeatMap();
      }
    },
  },
  mounted() {
    window.onresize = () => {
      this.myChart.resize();
    };
    this.pointsArrO = this.getDefaultPoints(this.pointsArrO, this.pointsArr);
    this.drawMap();

    this.initHeatMap();
  },
  methods: {
    // get Default heapPoints
    // Remember arrGet need to be returned as new Arr.
    // Otherwise it only make effect in this function scope.
    getDefaultPoints(arrGet, arrFrom) {
      // Complex data type needs DEEP COPY.
      arrGet = JSON.parse(JSON.stringify(arrFrom));
      // arrGet = deepclone(arrFrom);
    //   console.log("Default Origin Arr Length", arrGet.length);
      return arrGet;

      // arrGet = JSON.parse(JSON.stringify(arrFrom));
      // deepclone function is same to the string upper.
      function deepclone(obj) {
        console.log("BEFORE DEEP CLONE", obj.length);
        let _obj = JSON.stringify(obj);
        let cloneObj = JSON.parse(_obj);
        console.log("AFTER DEEP CLONE", cloneObj.length);

        return cloneObj;
      }
    },
    // Go back to default setting
    backDefault() {
      this.pointsArr = this.getDefaultPoints(this.pointsArr, this.pointsArrO);
      console.log("Lenght", this.pointsArrO.length, this.pointsArr.length);

      let dataFormatter = {
        max: 1000,
        min: 0,
        data: this.pointsArr,
      };
      this.heatMapIns.setData(dataFormatter);
    },
    clearCanvas() {
      var c = document.getElementById("mapTest");
      var cxt = c.getContext("2d");
      cxt.fillStyle = "#000000";
      cxt.beginPath();
      cxt.fillRect(0, 0, c.width, c.height);
      cxt.closePath();
    },
    // Add the heat points
    // First add the points. need to paint the MAX and MIN!!!
    addHeatPoints() {
      for (let i = 0; i < 10; i++) {
        let tX = getRandomInt(0, 900);
        let tY = getRandomInt(0, 700);
        let tV = getRandomInt(100, 1000);
        this.pointsArr.push({ x: tX, y: tY, value: tV });
        // console.log("Temp", tX, tY, tV);
      }
      let dataFormatter = {
        // Max and min data compare to show the heapMap color.
        max: 1000,
        min: 0,
        data: this.pointsArr,
      };
      this.heatMapIns.setData(dataFormatter);
      // Get random number
      function getRandomInt(min, max) {
        return Math.floor(Math.random() * (max - min + 1)) + min;
      }
    },
    // DELETE HeatMap
    deleteHeatMap() {
      let dataFormatter = {
        max: 1000,
        min: 0,
        data: [],
      };
      //   this.clearCanvas();
      this.heatMapIns.setData(dataFormatter);
      //   this.heatMapIns.repaint();
      console.log("Delete heatMap");
    },
    initHeatMap() {
      // Everytime repaint need to delete the last heatmap
      // this.deleteHeatMap();
      let self = this;
      this.heatMapIns = h337.create({
        container: document.getElementById("mapTest"),
        gradient: {
          //渐变颜色
          0: "rgba(255,255,255,1)", //value为0的颜色
          0.3: "#82ff6d", //value为500的颜色
          0.8: "#f3ff6d", //value为1000的颜色
          1: "#ff6d6d", //value为2000的颜色
        },
        maxOpacity: 1,
        minOpacity: 0,
        blur: 0.75,
      });

      let dataFormatter = {
        // Max and min data compare to show the heapMap color.
        max: 1000,
        min: 0,
        data: self.pointsArr,
      };
      this.heatMapIns.setData(dataFormatter);
    },
    drawMap() {
      if (
        this.myChart != null &&
        this.myChart != "" &&
        this.myChart != undefined
      ) {
        this.myChart.dispose();
      }
      this.$nextTick(() => {
        // let self = this;
        this.myChart = echarts.init(document.getElementById("mapTestOrigin"));
        // HuaiAn
        let geoJson = "http://localhost:8080/static/mapHuaiAn.geoJson";

        // Axios---
        this.get(geoJson)
          .then((res) => {
            echarts.registerMap("HuaiAn", res);
            this.myChart.setOption({
              series: [
                {
                  type: "map",
                  map: "HuaiAn",
                  label: {
                    show: true,
                    color: "#222",
                  },
                },
              ],
            });
          })
          .catch((err) => {
            console.log("ERR", err);
          });
      });
    },
  },
};
</script>

<style>
</style>
效果如图