生物信息里面有几种典型的network:
- PPI,就是蛋白互做的网络,直接可以从STRING数据库下载;
- TF correlation network,就是根据转录组的数据来构建相关性;
- TF target network,SCENIC等就是做这个的;
自己构思有点难,那就开启写轮眼开始模仿吧。
这里推荐一篇论文:2015 – PNAS - Human cerebral organoids recapitulate gene expression programs of fetal neocortex development 【in vivo和in vitro单细胞比较】
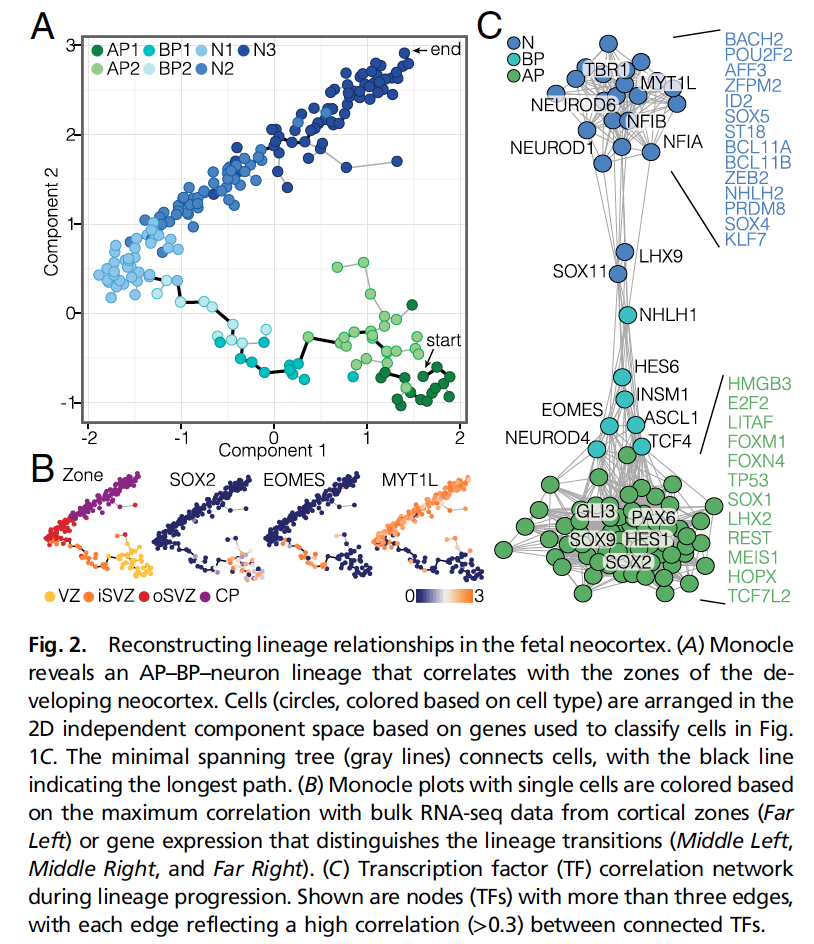
见图2C,为什么这种图这么受实验老板的喜欢,因为符合直觉感知,也提供了非常核心的信息。
- trajectory已经揭示了细胞的分化路径;
- TF网络则揭示了在每一个阶段发挥关键作用的TF;
信息不在多,而在于精,最后吧所有核心的TF列出来,实验的老板就high了。
如何代码实现?这篇文章很良心,方法里描述得比较清晰了。
For Fig. 2C, for the TF network analysis, we computed a pairwise correlation matrix for TFs annotated as such in the “Animal Transcription Factor Database” (www.bioguo.org/AnimalTFDB/) (39) and identified those TFs with a correlation of greater than 0.3 with at least three other TFs (99 TFs).
做了一个严格论证分析
We used a permutation approach to determine the probability of finding TFs meeting this threshold by chance. We randomly shuffled the columns (TFs) of each row (cells) 500 times and calculated the pairwise correlation matrix for each permutation of the input data frame. After each permutation, we counted the number of TFs meeting our threshold. The majority of randomized data frames (96%) resulted in 0 TFs that met our threshold. The maximum number of TFs that met our threshold was 2, which occurred in only 0.2% of the permutations. In contrast, our data resulted in 99 TFs that met this threshold, which suggests that our threshold was strict, but all nodes and connections that we present in the TF network are highly unlikely to be by chance.
We used the pairwise correlation matrix for the selected TFs as input into the function graph.adjacency() of igraph implemented in R (igraph.sf.net) to generate a weighted network graph, in which the selected TFs are presented as vertices and all pairwise correlations >0.2 are presented as edges linking the respective vertices.
The network graph was visualized using the fruchterman reingold layout.
好像有点废话了, 表达最高,那肯定相关,最后肯定在network被聚到一起。
TF vertices were manually color coded based on the expression pattern along the monocle lineage. Green, teal, and blue represent highest average expression in APs, BPs, and neurons, respectively.
以下是我的模仿结果:
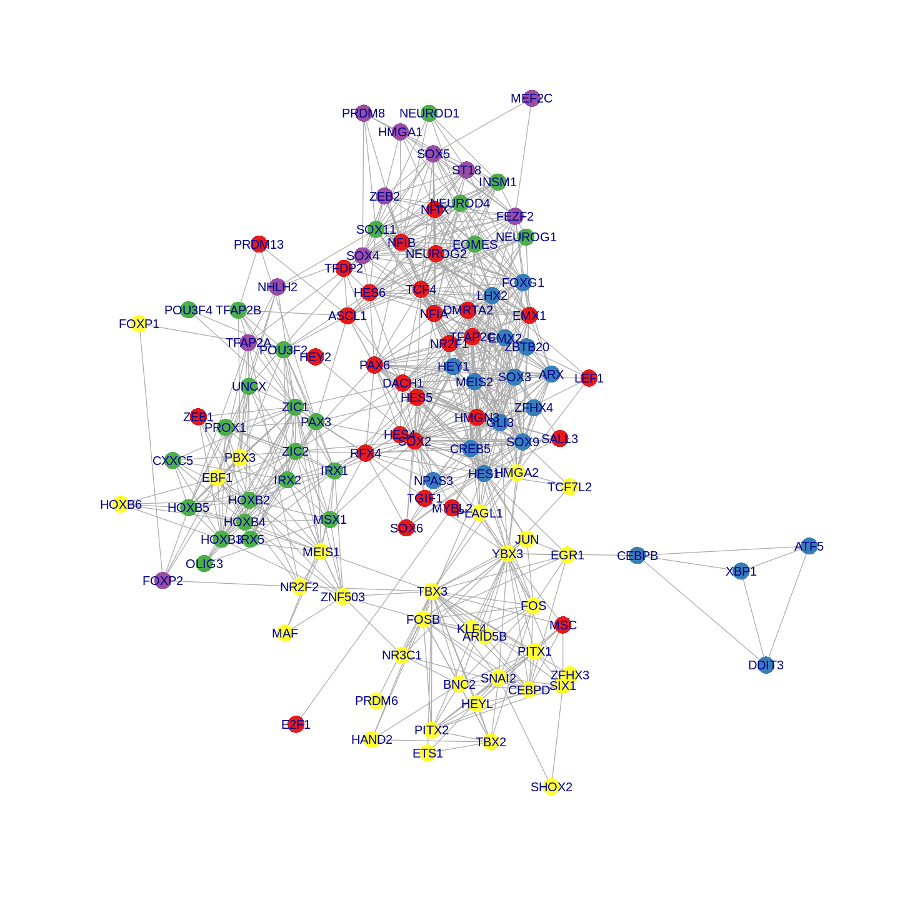
待续~