1.主题
虎扑体育网2016年至今关于巴萨的新闻
2.用python 编写爬虫程序,从网络上爬取相关主题的数据。
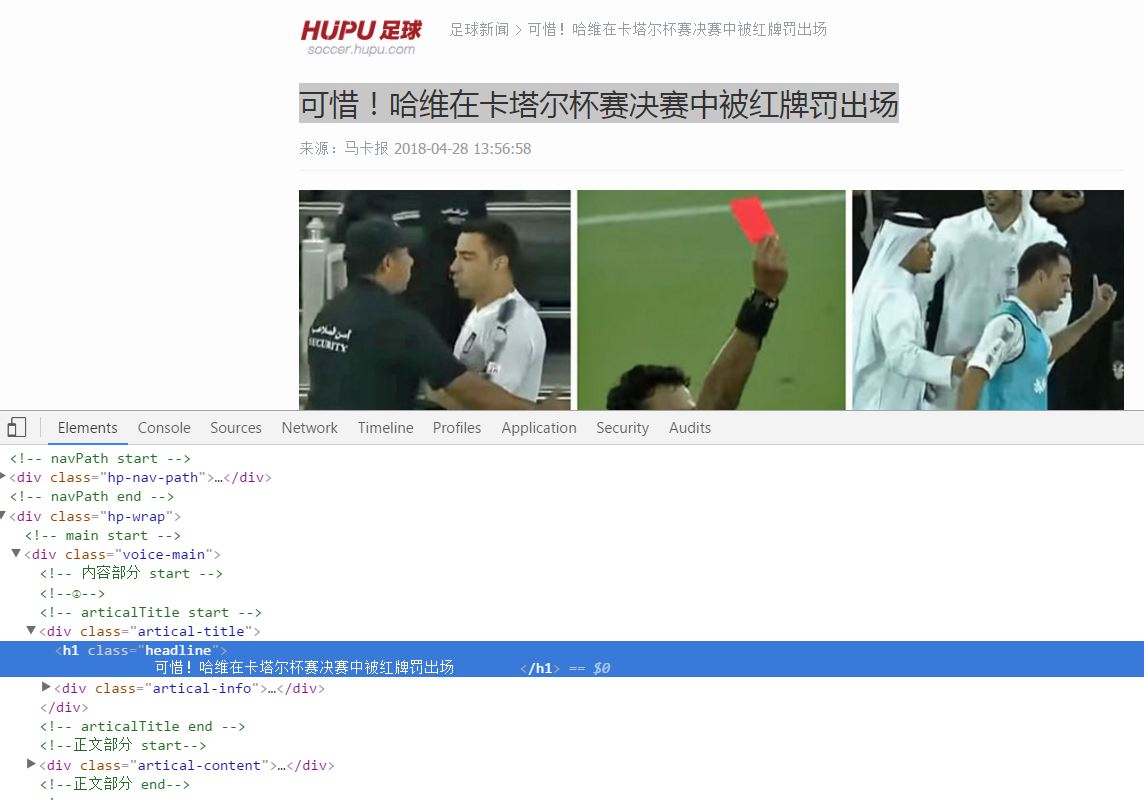
在虎扑巴萨新闻中用开发者工具找出相关信息
#新闻列表
pageUrl = 'https://voice.hupu.com/soccer/tag/380.html'
def getListPage(pageUrl):
    res = requests.get(pageUrl)
    res.encoding = 'utf-8'
    soup = BeautifulSoup(res.text, 'html.parser')
    newslist = []
    for news in soup.select('.voice-main'):
        if len(news.select('.time')) > 0:
            newsUrl = news.select('a')[0].attrs['href']  # 连接
            newslist.append(getNewDetail(newsUrl))
    return (newslist)

# 详情信息
def getNewDetail(newsUrl):
    resd = requests.get(newsUrl)
    resd.encoding = 'utf-8'
    soupd = BeautifulSoup(resd.text, 'html.parser')
    news = {}  # 用字典存放信息
    news['title'] = soupd.select('h1.headline')[0].text.strip()  # 标题
    news['source'] = soupd.select('.comeFrom')[0].text.strip().lstrip('来源:')  # 来源
    d = soupd.select('.time')[0].text.strip()
    news['time'] = datetime.strptime(d, '%Y-%m-%d %H:%M:%S')  # 时间
    n = soupd.select('.artical-content-read')[0].text
    if n.find('编辑:') > 0:
        news['content'] = n[:n.find('编辑:')].strip()
    else:
        news['content'] = n[:n.find('.artical-fn-tip-height')].strip()
    writeNewsDetail(news['content'])
    news['newsUrl'] = newsUrl  # 链接
    return (news)
# 导出到Excel表
df = pandas.DataFrame(newstotal)
df.to_excel('Barcelona.xlsx')

#生成文本
file = open('Barcelona.txt', 'r', encoding='utf-8')
word = file.read()
file.close()
3.对爬了的数据进行文本分析,生成词云。
文本分析:
for w in range(0, len(words)):
    wordDict[words[w]] = word.count(str(words[w]))

dictList = list(wordDict.items())
dictList.sort(key=lambda x: x[1], reverse=True)
bwc = {}
f = open('count.txt', 'a', encoding="utf-8")
for i in range(200):
    print(dictList[i])
    f.write(dictList[i][0] + ':' + str(dictList[i][1]) + '
')
    bwc[dictList[i][0]] = dictList[i][1]
f.close()
生成词云:
font = r'C:WindowsFontssimhei.TTF'
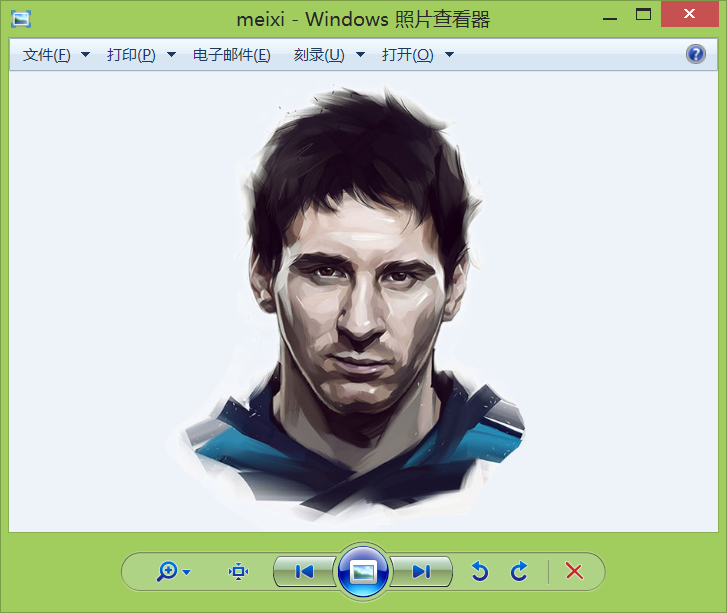
image = Image.open('./meixi.png')
graph = np.array(image)
wc = WordCloud(font_path=font, background_color='White', max_words=50, mask=graph)
wc.generate_from_frequencies(bwc)
image_color = ImageColorGenerator(graph)
plt.imshow(wc)
plt.axis("off")
plt.show()
原图:
词云:
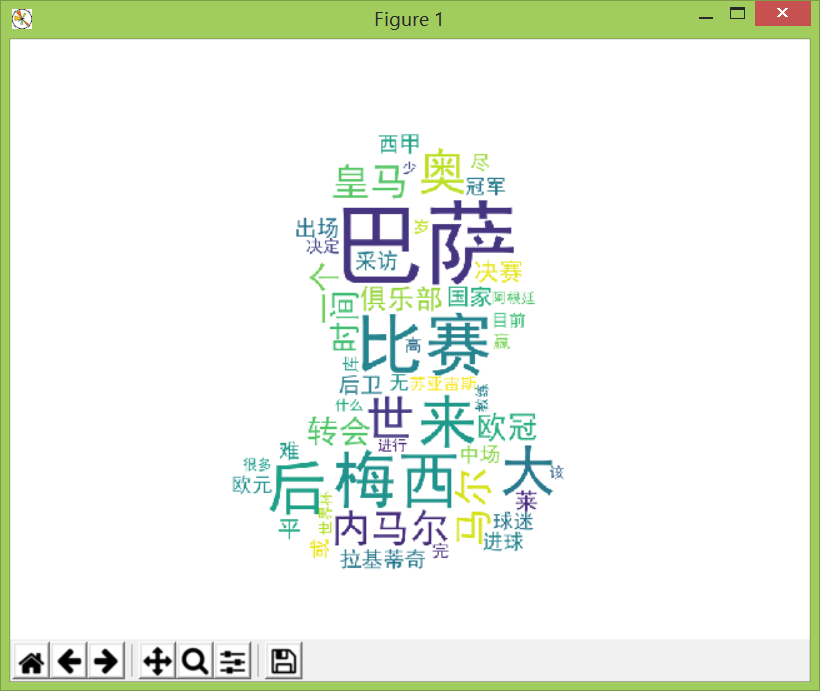
4.对文本分析结果进行解释说明。
从结果看,巴萨新闻中出现最多是:梅西、内马尔、皇马、
梅西:梅西作为巴萨的头号家球星,有关于巴塞的报道几乎与他有关
内马尔:过去几年内马尔是巴萨的二号球星,去年离开巴萨,词频略低于梅西
皇马:皇马是巴萨近十年的争冠对手,对阵即是国家德比,也是欧洲关注度最高的比赛
源代码:
import requests
from bs4 import BeautifulSoup
from datetime import datetime
import re
from PIL import Image, ImageSequence
import numpy as np
import matplotlib.pyplot as plt
from wordcloud import WordCloud, ImageColorGenerator
import pandas
import jieba

def writeNewsDetail(content):
    f = open('Barcelona.txt', 'a', encoding='utf-8')
    f.write(content)
    f.close()

 # 列表
def getListPage(pageUrl):
    res = requests.get(pageUrl)
    res.encoding = 'utf-8'
    soup = BeautifulSoup(res.text, 'html.parser')
    newslist = []
    for news in soup.select('.voice-main'):
        if len(news.select('.time')) > 0:
            newsUrl = news.select('a')[0].attrs['href']  # 连接
            newslist.append(getNewDetail(newsUrl))
    return (newslist)

# 详情信息
def getNewDetail(newsUrl):
    resd = requests.get(newsUrl)
    resd.encoding = 'utf-8'
    soupd = BeautifulSoup(resd.text, 'html.parser')
    news = {}  # 用字典存放信息
    news['title'] = soupd.select('h1.headline')[0].text.strip()  # 标题
    news['source'] = soupd.select('.comeFrom')[0].text.strip().lstrip('来源:')  # 来源
    d = soupd.select('.time')[0].text.strip()
    news['time'] = datetime.strptime(d, '%Y-%m-%d %H:%M:%S')  # 时间
    n = soupd.select('.artical-content-read')[0].text
    if n.find('编辑:') > 0:
        news['content'] = n[:n.find('编辑:')].strip()
    else:
        news['content'] = n[:n.find('.artical-fn-tip-height')].strip()
    writeNewsDetail(news['content'])
    news['newsUrl'] = newsUrl  # 链接
    return (news)

pageUrl = 'https://voice.hupu.com/soccer/tag/380.html'
newstotal = []
for i in range(1, 100):
    listPageUrl = 'https://voice.hupu.com/soccer/tag/380.html?page={}'.format(i)
    newstotal.extend(getListPage(listPageUrl))

for news in newstotal:
    print(news)

# 导出到Excel表
df = pandas.DataFrame(newstotal)
df.to_excel('Barcelona.xlsx')

#生成文本
file = open('Barcelona.txt', 'r', encoding='utf-8')
word = file.read()
file.close()
sep = '''-/.·+—…(),,。:?“”:、;!《》【】0123456789'''
exclude = {' ', '
', '	', 'xa0',  '到', '文', '人', '动', '和', '分', '能', '年', '手', '得', '也', '本', '要', '就', '很', '于', '将', '都',
           '下', '但', '小', '而', '她', '更', '最', '重', '还', '自', '次', '之', '月', '局', '说', '间', '里', '两',  '没', '家',
           '用', '级', '被', '并', '感', '回', '让', '作', '去', '位', '虎扑', '与', '天', '看', '面', '事', '因', '行', '拿', '已', '其',
           '教', '起', '从', '未', '表', '强', '练', '可', '多', '现', '发', '组', '如', '接', '没有', '可以',  '此', '所','我们','出',
           '球', '的','在','我','是','一','了','他','这','场', '们','会','不','比','有', '为','队','日','马','中','斯','时','梅',
           '拉', '蒂', '上','对',  '前','个','个', '进','虎','(','(','扑','经','日讯', '只','球员','巴','克','加','阿','球队','好','内','报','特','以','那','过','道','奥''世','杯','他们','已经','当','尼','利','达','德','赛季','战','世界','足球','你','想','联','同',自己','表示','望','乌','转','o','约','第','卡','名','么','据','体育','a', '新','希望','非','踢','根','谈','诺', '可能','问','这样','因为','卫','正','巴黎','西班牙','打','做','非常','联赛','r','00','罗贝托','奇','如果','认为','布','万','期','给','地','点','体育报','尼奥','情','离','接受','需','胜','入','相','但是','每','近','不是','消息','n','表现','图','三','外','变'
           }

jieba.add_word('国家德比')
jieba.add_word('C罗')
jieba.add_word('梅开二度')
jieba.add_word('大四喜')
jieba.add_word('拉基蒂奇')

for c in sep:
    word = word.replace(c, ' ')
wordList = list(jieba.cut(word))
wordDict = {}
words = list(set(wordList) - exclude)

for w in range(0, len(words)):
    wordDict[words[w]] = word.count(str(words[w]))

dictList = list(wordDict.items())
dictList.sort(key=lambda x: x[1], reverse=True)
bwc = {}
f = open('count.txt', 'a', encoding="utf-8")
for i in range(200):
    print(dictList[i])
    f.write(dictList[i][0] + ':' + str(dictList[i][1]) + '
')
    bwc[dictList[i][0]] = dictList[i][1]
f.close()

font = r'C:WindowsFontssimhei.TTF'
image = Image.open('./meixi.png')
graph = np.array(image)
wc = WordCloud(font_path=font, background_color='White', max_words=50, mask=graph)
wc.generate_from_frequencies(bwc)
image_color = ImageColorGenerator(graph)
plt.imshow(wc)
plt.axis("off")
plt.show()