1、代码:
%% ------------------------------------------------------------------------
%%            Output Info about this m-file
fprintf('
***********************************************************
');
fprintf('        <DSP using MATLAB> Problem 2.2.1

');

time_stamp = datestr(now, 31);
[wkd1, wkd2] = weekday(today, 'long');
fprintf('      Now is %20s, and it is %7s

', time_stamp, wkd2);
%% ------------------------------------------------------------------------

num = 100000;
x1 = 0 + (2-0)*rand(num,1);
x_axis = min(x1):0.02:max(x1);

figure('NumberTitle', 'off', 'Name', 'Problem 2.2.1 hist');
set(gcf,'Color','white');
%hist(x1,x_axis);
hist(x1,100);
title('Uniformly Distributed Random Numbers (using hist)');
xlabel('n'); ylabel('x1(n)'); grid on;


figure('NumberTitle', 'off', 'Name', 'Problem 2.2.1 bar');
set(gcf,'Color','white');
%[counts,binlocal] = hist(x1, x_axis);
[counts,binlocal] = hist(x1, 100);
counts = counts/num;
bar(binlocal, counts, 1); title('Uniformly Distributed Random Numbers (using bar)');
xlabel('n'); ylabel('x1(n)'); grid on;
运行结果:


2、代码:
%% ------------------------------------------------------------------------
%%            Output Info about this m-file
fprintf('
***********************************************************
');
fprintf('        <DSP using MATLAB> Problem 2.2.2

');

time_stamp = datestr(now, 31);
[wkd1, wkd2] = weekday(today, 'long');
fprintf('      Now is %20s, and it is %7s

', time_stamp, wkd2);
%% ------------------------------------------------------------------------

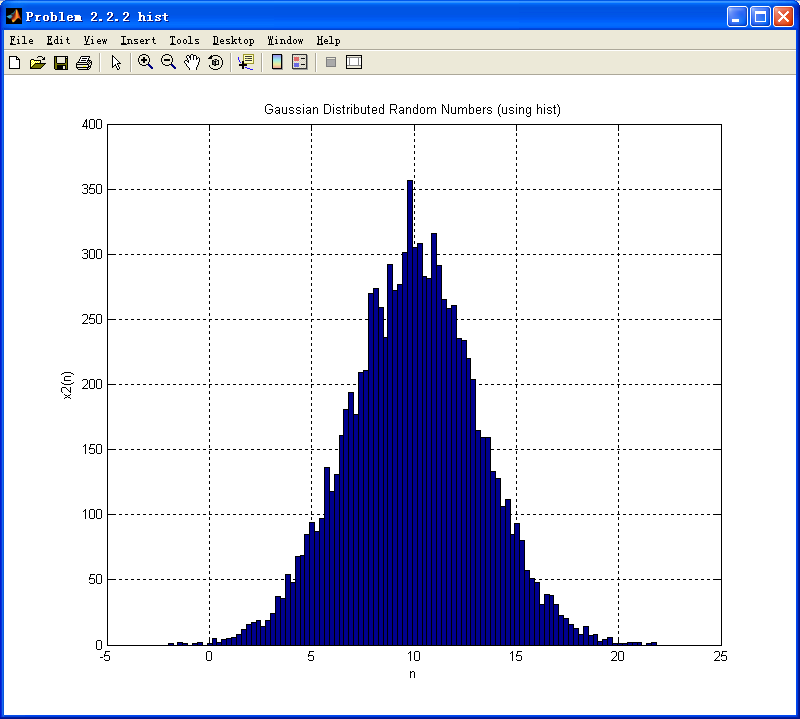
num = 10000; mean_val=10; variance=10;
x2 = mean_val + sqrt(variance)*randn(num,1);
x_axis = min(x2):0.02:max(x2);


figure('NumberTitle', 'off', 'Name', 'Problem 2.2.2 hist');
set(gcf,'Color','white');
%hist(x1,x_axis);
hist(x2,100);
title('Gaussian Distributed Random Numbers (using hist)');
xlabel('n'); ylabel('x2(n)'); grid on;

figure('NumberTitle', 'off', 'Name', 'Problem 2.2.2 bar');
set(gcf,'Color','white');
%[counts,binlocal] = hist(x1, x_axis);
[counts,binlocal] = hist(x2, 100);
counts = counts/num;
bar(binlocal, counts, 1); title('Gaussian Distributed Random Numbers (using bar)');
xlabel('n'); ylabel('x2(n)'); grid on;
运行结果:


3、代码:
%% ------------------------------------------------------------------------
%%            Output Info about this m-file
fprintf('
***********************************************************
');
fprintf('        <DSP using MATLAB> Problem 2.2.3

');

time_stamp = datestr(now, 31);
[wkd1, wkd2] = weekday(today, 'long');
fprintf('      Now is %20s, and it is %7s

', time_stamp, wkd2);
%% ------------------------------------------------------------------------

num = 100000;  n_x1 = 0:num-1;
x1 = 0 + (2-0)*rand(num,1);
%x_axis = min(x2):0.02:max(x2);
[x11,n_x11] = sigshift(x1,n_x1,1)
[x3,n_x3] = sigadd (x1, n_x1, x11, n_x11)


%% -------------------------------- START --------------------------------------------
%  x1(n)'s hist and bar function
figure('NumberTitle', 'off', 'Name', 'Problem 2.2.3');
set(gcf,'Color','white');
hist(x1,100);
title('Uniformly Distributed Random Numbers (using hist)');
xlabel('n'); ylabel('x1(n)'); grid on;

figure('NumberTitle', 'off', 'Name', 'Problem 2.2.3');
set(gcf,'Color','white');
[counts,binlocal] = hist(x1, 100);
counts = counts/num;
bar(binlocal, counts, 1); title('Uniformly Distributed Random Numbers (using bar)');
xlabel('n'); ylabel('x1(n)'); grid on;
%% ---------------------------------- END ------------------------------------------------


%% -------------------------------- START --------------------------------------------
%   x3(n) = x1(n) + x1(n-1)   hist and bar function
figure('NumberTitle', 'off', 'Name', 'Problem 2.2.3');
set(gcf,'Color','white');
hist(x3,100);
title('Uniformly Distributed Random Numbers (using hist)');
xlabel('n'); ylabel('x3(n)'); grid on;

figure('NumberTitle', 'off', 'Name', 'Problem 2.2.3');
set(gcf,'Color','white');
[counts,binlocal] = hist(x3, 100);
counts = counts/num;
bar(binlocal, counts, 1); title('Uniformly Distributed Random Numbers (using bar)');
xlabel('n'); ylabel('x3(n)'); grid on;
%% ---------------------------------- END ------------------------------------------------
运行结果:


两个均匀分布的序列相加,结果呈现三角形分布了。
4、代码:
%% ------------------------------------------------------------------------
%%            Output Info about this m-file
fprintf('
***********************************************************
');
fprintf('        <DSP using MATLAB> Problem 2.2.4

');

time_stamp = datestr(now, 31);
[wkd1, wkd2] = weekday(today, 'long');
fprintf('      Now is %20s, and it is %7s

', time_stamp, wkd2);
%% ------------------------------------------------------------------------

num = 100000;  n_y = 0:num-1;
y1 = -0.5 + (0.5+0.5)*rand(num,1);
y2 = -0.5 + (0.5+0.5)*rand(num,1);
y3 = -0.5 + (0.5+0.5)*rand(num,1);
y4 = -0.5 + (0.5+0.5)*rand(num,1);

%x_axis = min(x2):0.02:max(x2);
[x41,n_y11] = sigadd (y1, n_y, y2, n_y);
[x42,n_y12] = sigadd (y3, n_y, y4, n_y);
[x4,n_x4] = sigadd (x41, n_y11, x42, n_y12);


%% -------------------------------- START --------------------------------------------
%  x1(n)'s hist and bar function
figure('NumberTitle', 'off', 'Name', 'Problem 2.2.4');
set(gcf,'Color','white');
hist(y1,100);
title('Uniformly Distributed Random Numbers (using hist)');
xlabel('n'); ylabel('y1(n)'); grid on;

figure('NumberTitle', 'off', 'Name', 'Problem 2.2.4');
set(gcf,'Color','white');
[counts,binlocal] = hist(y1, 100);
counts = counts/num;
bar(binlocal, counts, 1); title('Uniformly Distributed Random Numbers (using bar)');
xlabel('n'); ylabel('y1(n)'); grid on;
%% ---------------------------------- END ------------------------------------------------


%% -------------------------------- START --------------------------------------------
%   x3(n) = x1(n) + x1(n-1)   hist and bar function
figure('NumberTitle', 'off', 'Name', 'Problem 2.2.4');
set(gcf,'Color','white');
hist(x4,100);
title('Uniformly Distributed Random Numbers (using hist)');
xlabel('n'); ylabel('x4(n)'); grid on;

figure('NumberTitle', 'off', 'Name', 'Problem 2.2.4');
set(gcf,'Color','white');
[counts,binlocal] = hist(x4, 100);
counts = counts/num;
bar(binlocal, counts, 1); title('Uniformly Distributed Random Numbers (using bar)');
xlabel('n'); ylabel('x4(n)'); grid on;
%% ---------------------------------- END ------------------------------------------------
运行结果:


4个均匀分布的随机序列相加,呈现正态分布的特征了。