代码:
M = 25; alpha = (M-1)/2; n = [0:1:M-1];
hd = (2/pi) * ( (sin( (pi/2)*(n-alpha) ).^2)./(n-alpha) ); hd(alpha+1) = 0;
w_han = (hann(M))';
h = hd .* w_han;
[Hr, w, P, L] = Hr_Type3(h);
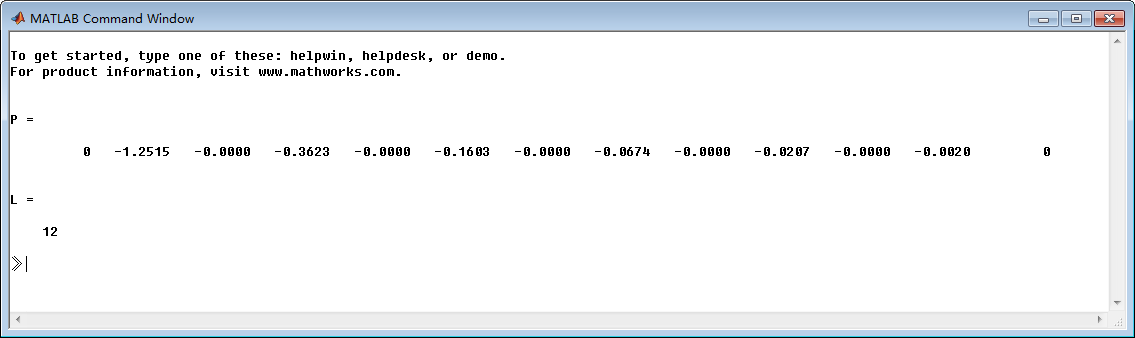
P
L
%Plot
figure('NumberTitle', 'off', 'Name', 'Exameple 7.13')
set(gcf,'Color','white');
subplot(2,2,1); stem(n, hd); axis([-1 M -1.2 1.2]); grid on;
xlabel('n'); ylabel('hd(n)'); title('Ideal Impulse Response');
subplot(2,2,2); stem(n, w_han); axis([-1 M 0 1.2]); grid on;
xlabel('n'); ylabel('w(n)'); title('Hann Window');
subplot(2,2,3); stem(n, h); axis([-1 M -1.2 1.2]); grid on;
xlabel('n'); ylabel('h(n)'); title('Actual Impulse Response');
w = w'; Hr = Hr';
w = [-fliplr(w), w(2:501)]; Hr = [-fliplr(Hr), Hr(2:501)];
subplot(2,2,4); plot(w/pi, Hr); axis([-1 1 -1.1 1.1]); grid on;
xlabel('frequency in pi units'); ylabel('Hr'); title('Amplitude Response');
运行结果:

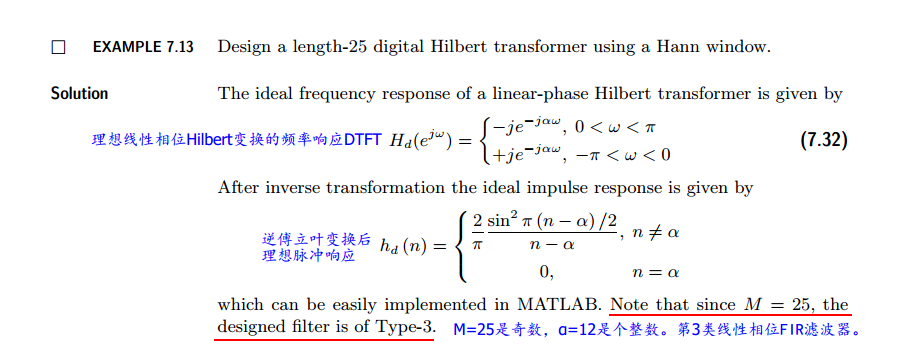
注意:振幅谱的频率范围是从-π到π。