代码:
% Discrete-time Signal x1(n) : Ts = 0.0002
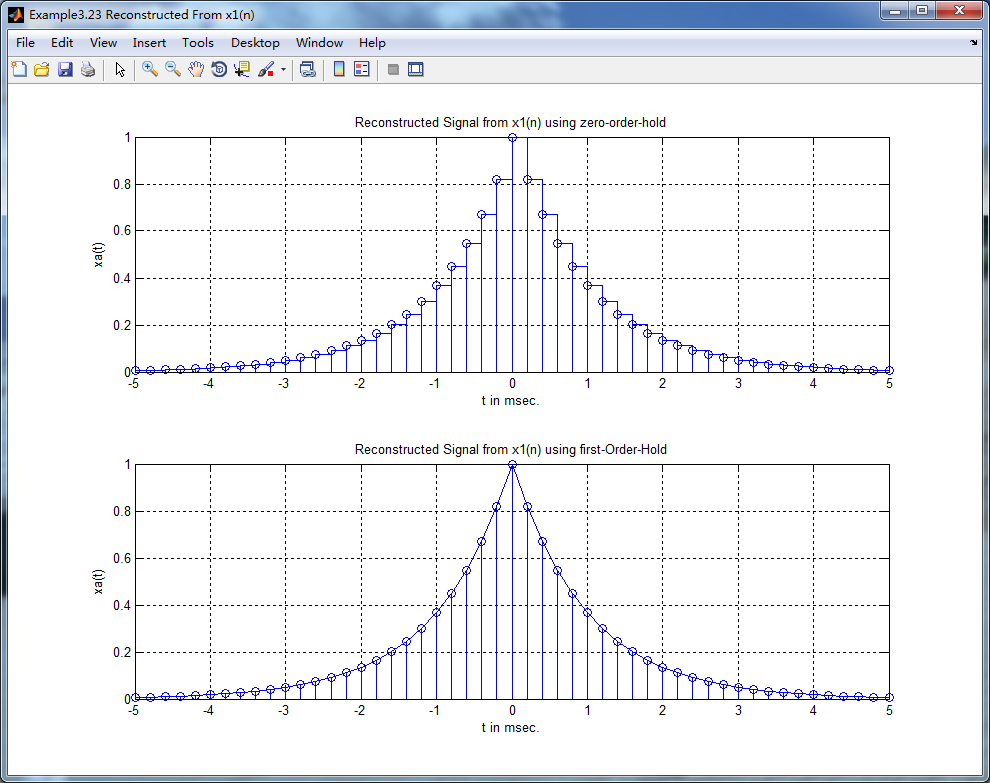
Ts = 0.0002; n = -25:1:25; nTs = n*Ts; x1 = exp(-1000*abs(nTs));
figure('NumberTitle', 'off', 'Name', 'Example3.23 Reconstructed From x1(n)');
set(gcf,'Color','white');
subplot(2,1,1); stairs(nTs*1000,x1); grid on; %axis([0,1,0,1.5]); % Zero-Order-Hold
title('Reconstructed Signal from x1(n) using zero-order-hold');
xlabel('t in msec.'); ylabel('xa(t)'); hold on;
stem(n*Ts*1000,x1); hold off;
subplot(2,1,2); plot(nTs*1000,x1); grid on; %axis([0,1,0,1.5]); % first-Order-Hold
title('Reconstructed Signal from x1(n) using first-Order-Hold');
xlabel('t in msec.'); ylabel('xa(t)'); hold on;
stem(n*Ts*1000,x1); hold off;
% Discrete-time signal x2(n) : Ts=0.001
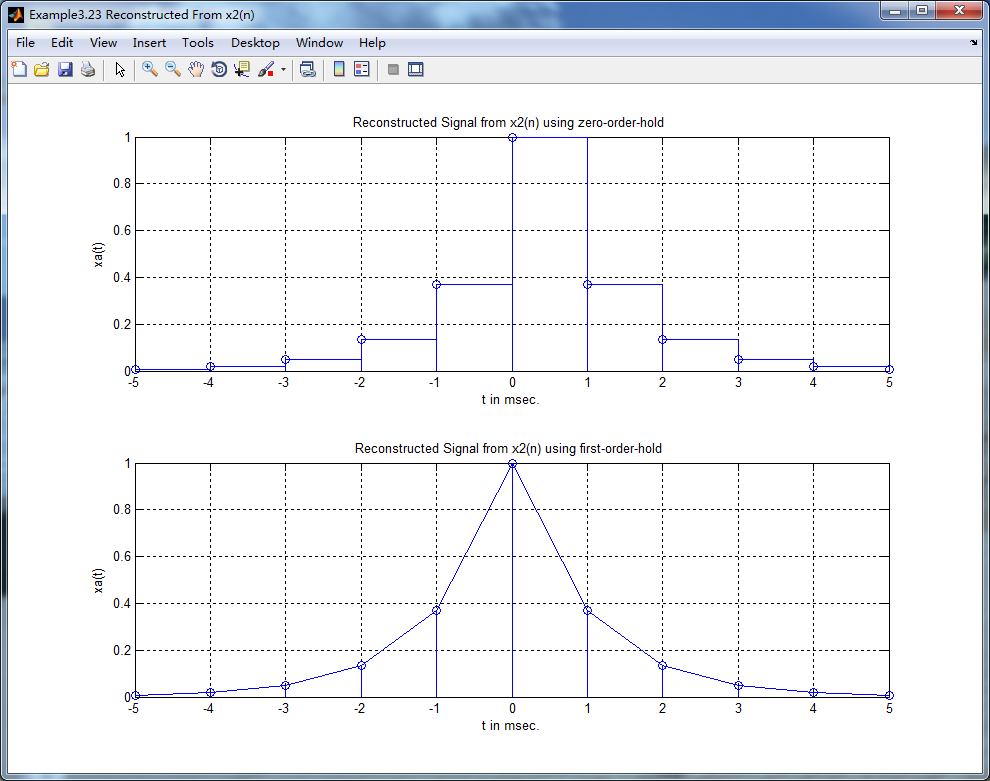
Ts = 0.001; n = -5:1:5; nTs = n*Ts; x2 = exp(-1000*abs(nTs));
% Plot
figure('NumberTitle', 'off', 'Name', 'Example3.23 Reconstructed From x2(n)');
set(gcf,'Color','white');
subplot(2,1,1); stairs(nTs*1000, x2); grid on; % axis([-1,1,-1,1]); % Zero-Order-Hold
title('Reconstructed Signal from x2(n) using zero-order-hold ');
xlabel('t in msec.'); ylabel('xa(t)'); hold on;
stem(n*Ts*1000,x2); hold off;
subplot(2,1,2); plot(nTs*1000, x2); grid on; % axis([-1,1,-1,1]); % First-Order-Hold
title('Reconstructed Signal from x2(n) using first-order-hold ');
xlabel('t in msec.'); ylabel('xa(t)'); hold on;
stem(n*Ts*1000,x2); hold off;
运行结果: