cache buffers chains 看名字像是一个链表结构,但实际上它是一个latch。 要理解它,首先要理解下面的概念。
- hash bucket
- hash chain list
hash bucket和hash chain list是用来在data buffer里快速定位数据块的。oracle在访问一个数据块之前,首先会根据数据块的地址生成一个hash值。通过这个hash值,oracle可以快速的找到一个hash bucket(顾名思义,hash bucket就是一系列的桶,每一个桶都对应着一个hash值)。但是如果有多个数据块计算得出的hash值相等,那么oracle在访问他们的时候就会找到相同的hash bucket。这些数据块的header被组织到一个叫做hash chain list的链表中,该链表就放在这个hash bucket中。通过数据块的header,你可以找到数据块在buffer中的位置。总结一下就是,
- 通过data block address 计算出hash value
- 通过hash value定位到hash bucket
- 通过hash bucket中的hash chain list找到该hash bucket中所有数据块的header
- 通过数据块的header找到数据块
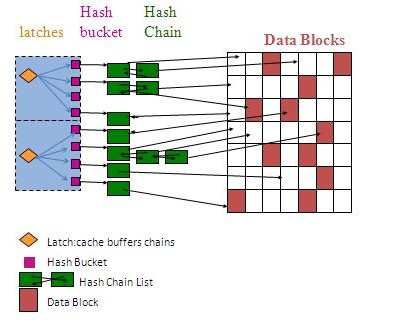
上面的图列出了访问data block的大概流程,但是可以看到在hash bucket之前还要访问一个 latch。这个latch就是我们开篇提到的 cache buffer chain。 这种latch一个管理着多个hash bucket,你只有获得了这样一个latch才能继续访问hash bucket,同其他latch存在的意义一样,该latch也是为了控制资源的并发访问。想象一下,如果没有该latch,两个进程在同一时间去修改 data buffer中的一个地址,可能就会导致出错。ok,我们需要重新梳理一下,因为这些名字都很像,会导致混乱。


cache buffer chain:是一个latch 保护 hash bucket

hash bucket:通过计算数据块的地址可以得到一个哈希值,通过该哈希值可以定位到一个hash bucket

hash chain list:是一个存放于hash bucket中的链表,链表上是该hash bucket中数据块的header

我们通过数据块的地址得到一个哈希值,通过该哈希值定位到一个hash bucket,在访问该hash bucket之前要先得到该hash bucket的latch,获得latch后访问hash bucket,进而访问hash chain list,获得若干数据块header,进而访问数据块。
梳理完毕,额外说一下,hash bucket的数量由隐藏参数 _db_block_hash_buckets控制。
了解了上面的内容后,我们就应该明白,当出现latch:cache buffers chains这样的等待事件的时候是怎么回事。这种等待是因为多个进程争用 同一个latch,也就意味着多个进程在争用同一个hash bucket,在争用同一个数据块。 还有一种可能是系统中有 BUFFER_GETS(逻辑读取) 很高的sql语句。(说实话第二种可能我不太明白。解答:仍然不确定,但猜想是这样的,cr读一般是指对一个数据块产生多个cr block。由于这些cr block都是同一个data block产生的,因而他们都对应着一个hash bucket自然就对应着一个cache buffer chain latch) 这时候我们可以用如下方法来 trouble shooting。
1. 检查逻辑读较高的sql语句 也就是找到v$sql中BUFFER_GETS/EXECUTIONS大的语句。
select * from (select sql_text,hash_value,buffer_gets/executions from v$sql where executions<>0 and hash_value in (select sql_hash_value from gv$session where status='ACTIVE' )order by buffer_gets/executions desc ) where rownum<16;
2. 查看v$latch,看自实例启动以来cache buffers chains锁存器争用是否厉害
select round((misses/gets)*100)||'%',round(100*(immediate_misses/(immediate_gets+immediate_misses)))||' %' from v$latch where name='cache buffers chains';
对于willing-to-wait,比较重要的是misses/gets,假如大于1%就应该发生争用了,大于10%,就有争用严重的情况了。对于no-wait模式immediate_misses/(immediate_gets+immediate_misses)也一样。(这一段是从网上copy过来的,不是太懂这个SQL的具体意义,不过这个查询的目的应该是判断系统的hash bucket设置是否正确吧)
3. 查询v$latch_children看是否有热块,并获取对应latch的addr
select * from (select addr,child#,gets,misses,sleeps from v$latch_children where name='cache buffers chains' order by sleeps desc ) where rownum<=20;
如果存在倾斜明显,即某些子锁存器的GETS与SLEEPS比其他子锁存器高很多,则可以推测相应锁存器管辖的chain上有Hot Block。然后通过子锁存器地址,即v$latch_children的addr字段,来获取这些子锁存器所管理的对象的文件号块号与热度。
select hladdr,obj,(select object_name from dba_objects where (data_object_id is null and object_id=x.obj) or data_object_id=x.obj and rownum=1) as object_name,dbarfil,dbablk,tch
from x$bh x
where hladdr in ('00000000DA253C08','00000000DA380310') order by tch desc;
注意x$bh字典表中的tch字段表示的就是block的touch count,一般来说这个值越高那么这个块就越热,我们称这样的块就叫做热点块。接下来根据FILE#,dbablk来找出对应对象。
select * from dba_extents where file_id=10 and 36643122 between block_id and block_id + blocks - 1;
select * from (select hladdr,ts#,file#,dbarfil,dbablk,tch from x$bh order by tch desc) where rownum<16;
select * from dba_extents where file_id=10 and 36643122 between block_id and block_id + blocks - 1;
出现热块的解决办法
下面的内容是从oracle的官方文档(Performance tunning guide)上copy的,可以一读。
10.3.10.3.5 cache buffers chainsThe To identify the heavily accessed buffer chain, and hence the contended for block, look at latch statistics for the This latch has a memory address, identified by the SELECT OBJ data_object_id, FILE#, DBABLK,CLASS, STATE, TCH
FROM X$BH
WHERE HLADDR = 'address of latch'
ORDER BY TCH;
Many blocks are protected by each latch. One of these buffers will probably be the hot block. Any block with a high After you have identified the hot block, you can identify the segment it belongs to with the following query: SELECT OBJECT_NAME, SUBOBJECT_NAME
FROM DBA_OBJECTS
WHERE DATA_OBJECT_ID = &obj;
In the query, |
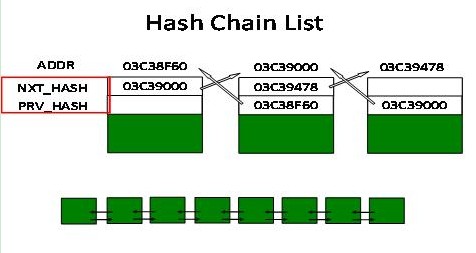
另外,从x$bh中我们可以看到hash chain list的相关信息
SQL> desc x$bh
 Name                                      Null?    Type
 ----------------------------------------- -------- ----------------------------
 ADDR                                               RAW(8)
 HLADDR                                             RAW(8)
 NXT_HASH                                           RAW(8)
 PRV_HASH                                           RAW(8)
 NXT_REPL                                           RAW(8)
 PRV_REPL                                           RAW(8)
But, of course, this is not the whole x$bh. Actually from below picture you can understand more clearly.