文章GWAS分析脚本在:https://github.com/MareesAT/GWA_tutorial/
GWAS的目的是检测不同群体(case-control)间allele frequency 显著差异(5*10^-8)的SNP。
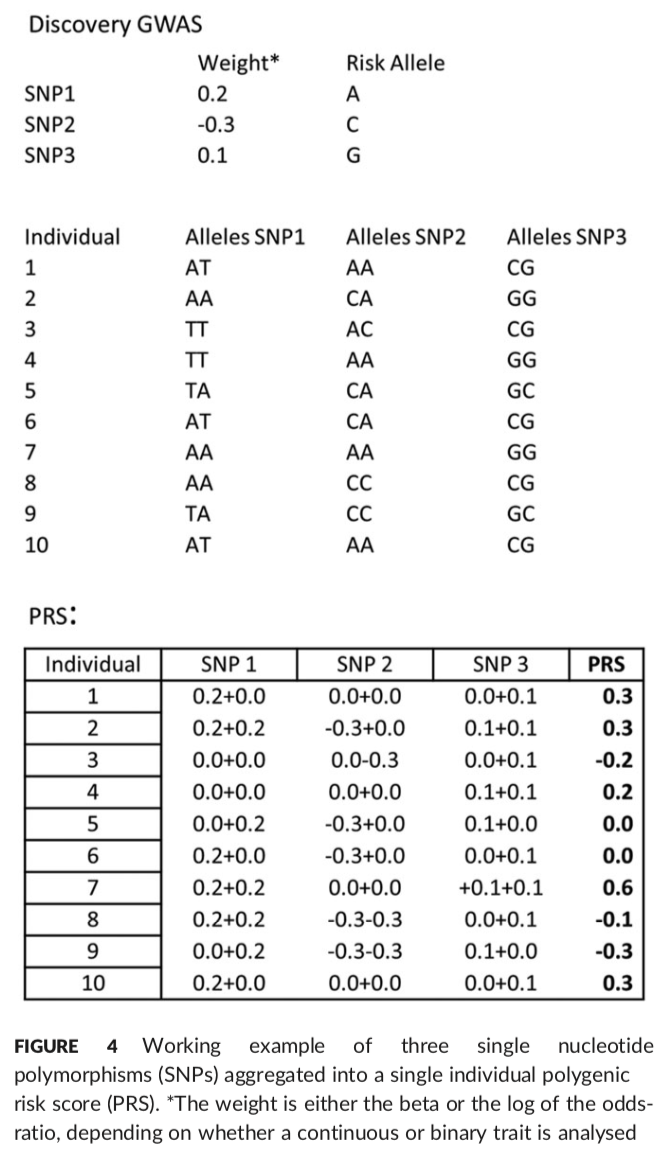
因为GWAS结果展示几个SNPs的effect size较小,所以开发了结合多个SNPs效应量为一个score的方法来预测disease risk。这个方法就是PRS,polygenic risk score。PRS是个体水平的score,它的统计基于个体携带风险变异的数量,通过SNP效应量来评估特定性状的genetic risk。
1.GWAS 首先就是七部过滤
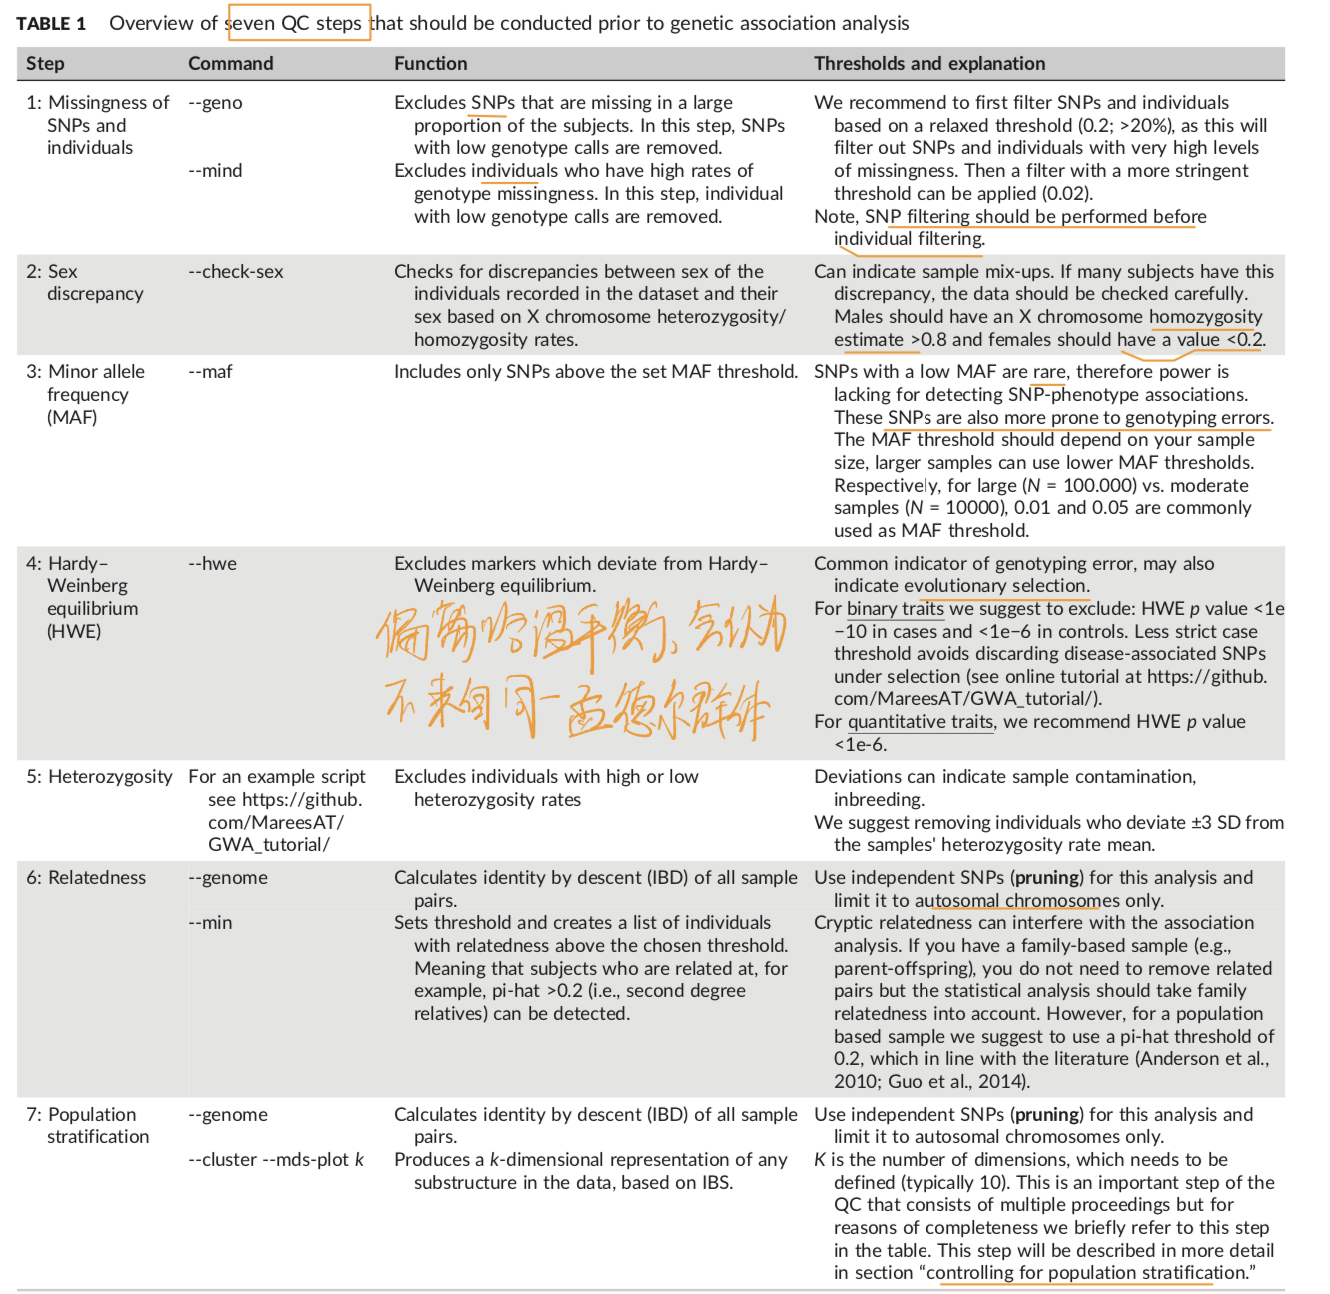
值得注意是最后一步对群体分层的控制。方法可以用plink的MDS方法(the multidimensional scaling)。https://github.com/ MareesAT/GWA_tutorial/ (2_Population_stratification.zip)

2.接下来就是对Binary(定性)以及QUANTITATIVE定量性状的关联统计检验。https://github.com/MareesAT/GWA_tutorial/ (3_Association_GWAS.zip).
2.1 定性性状Binary统计检验
value 1 = unaffected and value 2 = affected; 0 and -9 represent missing
检验用-assoc 运行X2检验;--logistic运行logistic 回归,logistic可以输入协变量covariates。--logistic要比--assoc更灵活,只是运行时间较久。
2.2 定量性状
--assoc或--linear。--assoc 运行Student's test来比较两个平均值。--linear可以输入协变量,执行linear regression 分析。只是比--assoc慢一点。
2.3 校正多重检验 Correction for multiple testing
广泛应用的genome-wide显著阈值是5*10^-8,欧洲群体尤其如此。但是因为African popultaion更多的遗传多样性,需要设为1*10^-8.三个广泛用于检测genome-wide显著性的方法是Bonferroni correction、FDR(Benjamini-Hochberg false discovery rate),permutation testing。
--adjust运行Bonferroni和FDR correction。
3.PRS 分析
要开展PRS分析,首先要从GWAS得到continuous traits的beta;binary traits的odds ratios的log值。
首先clumping。其次计算risk scores,plink的--score可以计算;PRSice会考虑clumping,p value,MDS components以及plots attrative graphs,很好。https://github.com/MareesAT/GWA_tutorial/ (4_PRS.doc)
在GWAS之后,通常会有很多的post-GWAS分析,下面提到的可以用来做summary statistics。
GTEx用于SNPs和基因表达关联分析。
Ensembl和FUMA用于功能注释funcitonal annotation。
GCTA和LD score regression分析用于计算SNP-based heritability。
Gene-based tests对表型和一个基因内的多个SNPs关联分析。
pathway/gene-set分析生物学通路。
注:
Clumping: This is a procedure in which only the most significant SNP (i.e., lowest p value) in each LD block is identified and selected for further analyses. This reduces the correlation between the remaining SNPs, while retaining SNPs with the strongest statistical evidence.
Heterozygosity杂合度:一个个体的杂合度是杂合genotypes的比例。个体杂合度过高可能表明样本质量低,杂合度过低表明近亲结婚。
Summary statistics: These are the results obtained after conducting a GWAS, including information on chromosome number, position of the SNP, SNP(rs)! identifier, MAF, effect size (odds ratio/beta), standard error, and p value. Summary statistics of GWAS are often freely accessible or shared between researchers.