代码示例:https://github.com/741978260/delay-spring-boot-starter.git
一、简述
Spring Boot Actuator可以帮助你监控和管理Spring Boot应用,比如健康检查、审计、统计和HTTP追踪等。所有的这些特性可以通过JMX或者HTTP endpoints来获得
Prometheus是一个开源的监控系统,数据爬虫:根据配置的时间定期的通过HTTP抓去metrics数据;time-series 数据库:存储所有的metrics数据;简单的用户交互接口:可视化、查询和监控所有的metrics
Grafana使你能够把来自不同数据源比如Elasticsearch, Prometheus, Graphite, influxDB等多样的数据以绚丽的图标展示出来;它也能基于你的metrics数据发出告警。当一个告警状态改变时,它能通知你通过email,slack或者其他途径
二、应用
1. 应用添加依赖
<!--监控报警-->
<dependency>
    <groupId>org.springframework.boot</groupId>
    <artifactId>spring-boot-starter-actuator</artifactId>
</dependency>
2.验证
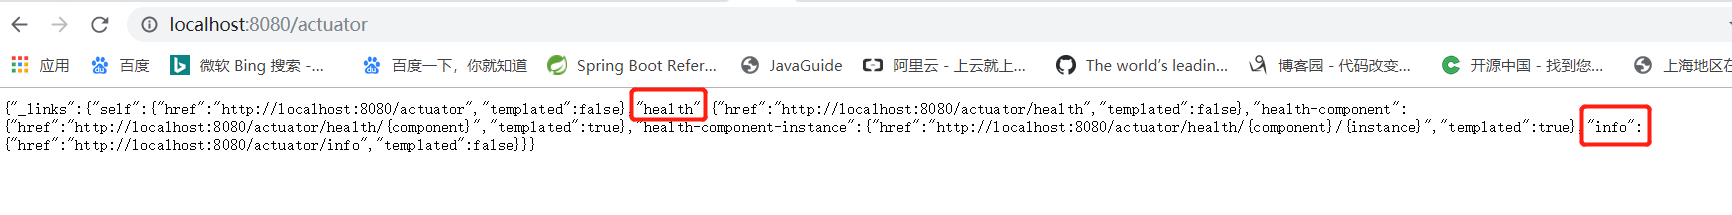
应用启动了,你可以通过http://localhost:8080/actuator来展示所有通过HTTP暴露的endpoints
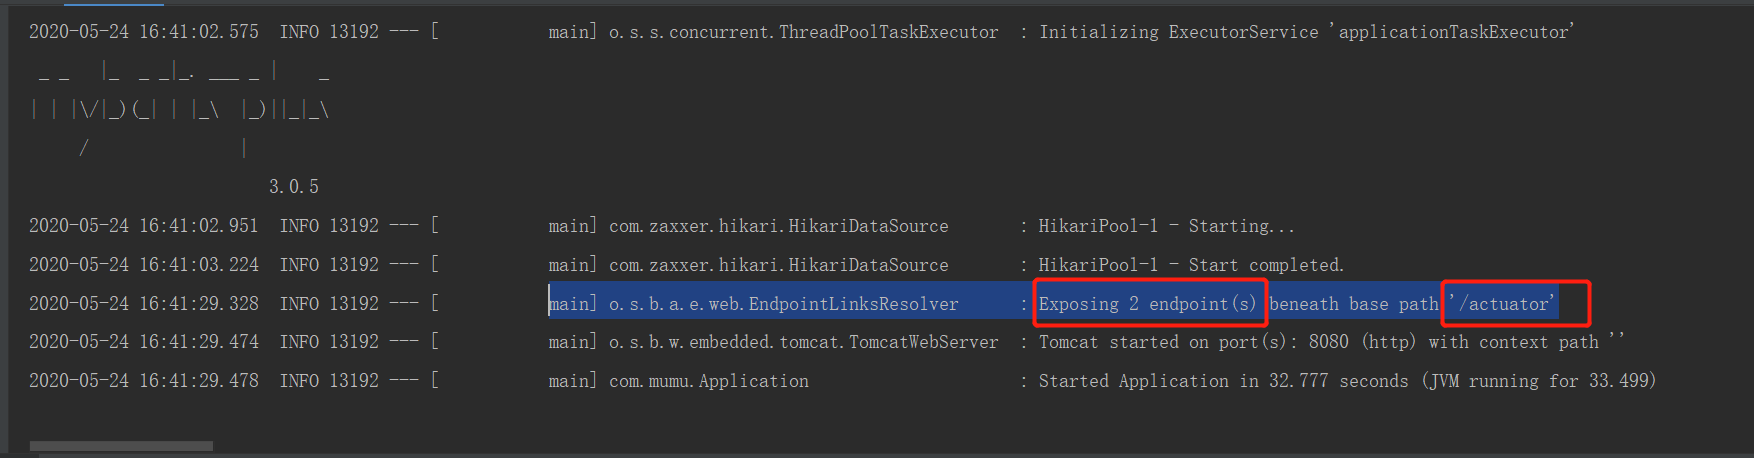
默认暴露了2个端点,端点进入,可以看到是health 、info
3.添加配置
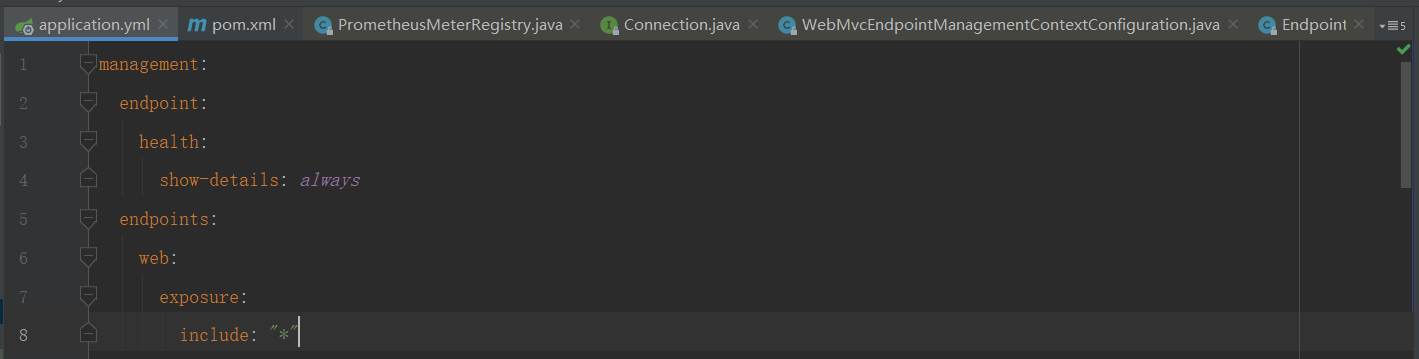
通过设置management.endpoints.web.exposure.include为*,暴露了所有端点;management.endpoint.health.show-details为always 可以展示细节
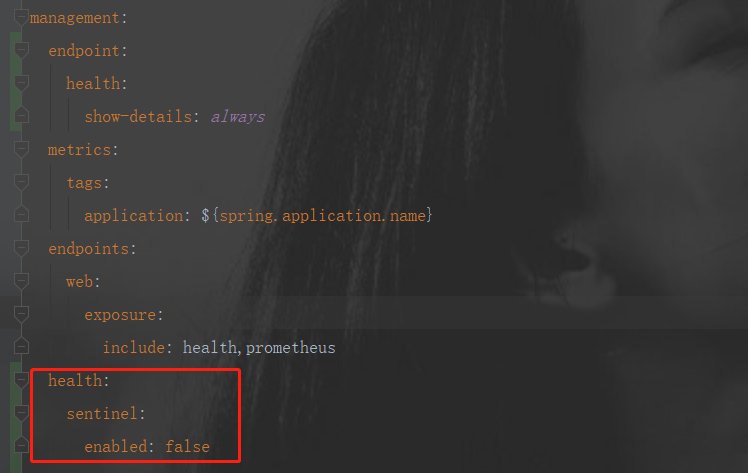
针对health检查,指定去掉某项的检查(比如不监控health.mail,health.sentinel):
4.增加Micrometer Prometheus Registry到你的Spring Boot应用
Spring Boot使用Micrometer,一个应用metrics组件,将actuator metrics整合到外部监控系统中;为了整合Prometheus,你需要增加micrometer-registry-prometheus依赖:
<!-- Micrometer Prometheus registry  -->
<dependency>
    <groupId>io.micrometer</groupId>
    <artifactId>micrometer-registry-prometheus</artifactId>
</dependency>
一旦你增加上述的依赖,Spring Boot会自动配置一个PrometheusMeterRegistry和CollectorRegistry来收集和输出格式化的metrics数据,使得Prometheus服务器可以爬取。
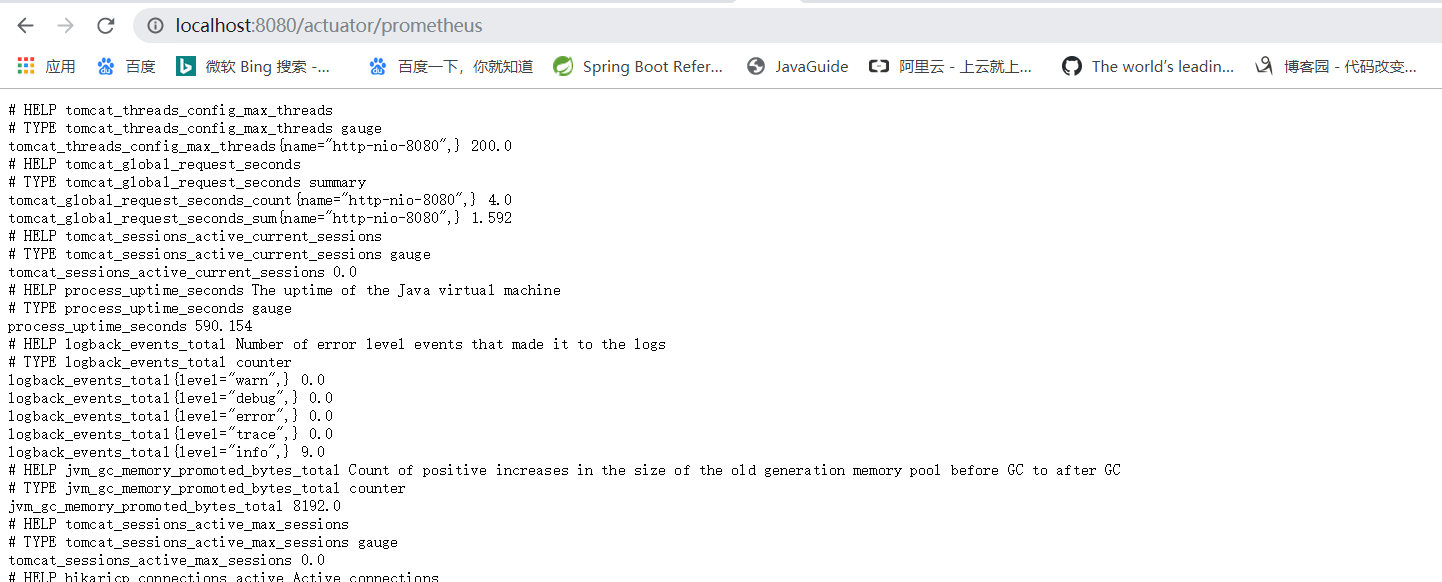
所有应用的metrics数据是根据一个叫/prometheus的endpoint来设置是否可用。Prometheus服务器可以周期性的爬取这个endpoint来获取metrics数据
验证:
5.使用Docker下载和运行Prometheus (linux下docker下载应用参加上一篇文章)
你可以使用docker pull命令来下载Prometheus docker image
docker images
docker pull prom/prometheus
docker images
mkdir prometheus
cd prometheus/
touch prometheus.yml
vim prometheus.yml
6.Prometheus配置(prometheus.yml)

7.使用Docker运行Prometheus
docker run -d --name=prometheus -p 9090:9090 -v /opt/prometheus/prometheus.yml:/opt/prometheus/prometheus.yml prom/prometheus --config.file=/opt/prometheus/prometheus.yml
docker ps
8.在Prometheus仪表盘中可视化Spring Boot Metrics

9.使用Docker下载和运行Grafana
docker images
docker pull grafana/grafana
docker images
docker run -d --name=grafana -p 3000:3000 grafana/grafana
docker ps
10.你可以访问http://xxx:3000,并且使用默认的账户名(admin)密码(admin)来登录Grafana

11.添加dashboard,编写prometheus的查询表达式