Web GIS系列:
1.搭建简易Web GIS网站:使用GeoServer+PostgreSQL+PostGIS+OpenLayers3
2.使用GeoServer+QGIS发布WMTS服务
3.使用GeoServer+OpenLayers发布和调用WMTS、Vector Tile矢量切片服务
4.Leaflet入门:添加点线面并导入GeoJSON数据
OpenLayers与Leaflet都是开源WebGIS组件中的佼佼者。之前的WebGIS系列博客中,重点以OpenLayers为JavaScript库,获得了广大GISer的关注。本文将对Leaflet进行详细介绍。所有代码都会整理并上传到GitHub上,欢迎Star和Fork!
本篇文章主要参考了Leaflet官方的入门介绍。
Quick Start
Using GeoJSON
第一幅地图
首先是初始化地图并加载底图,其中setView可以设定视图的中心点和缩放层级。对于底图,可以调用OSM的切片地图,也可以调用Mapbox的切片地图。对于Mapbox的地图,需要申请API key之后才能调用。不同风格的地图可以参考:https://studio.mapbox.com/tilesets/
初始化地图代码如下:
// Init the map
var mymap = L.map('mapid').setView([51.505, -0.09], 13);
// Load the tiled layer
L.tileLayer('https://api.tiles.mapbox.com/v4/mapbox.streets/{z}/{x}/{y}.png?access_token={YOUR_TOKEN}', {
attribution: 'Map data © <a href="https://www.openstreetmap.org/">OpenStreetMap</a> contributors, <a href="https://creativecommons.org/licenses/by-sa/2.0/">CC-BY-SA</a>, Imagery © <a href="https://www.mapbox.com/">Mapbox</a>',
maxZoom: 18,
id: 'mapbox.streets',
accessToken: '{YOUR_TOKEN}',
}).addTo(mymap);
初始化地图后效果如下图所示。
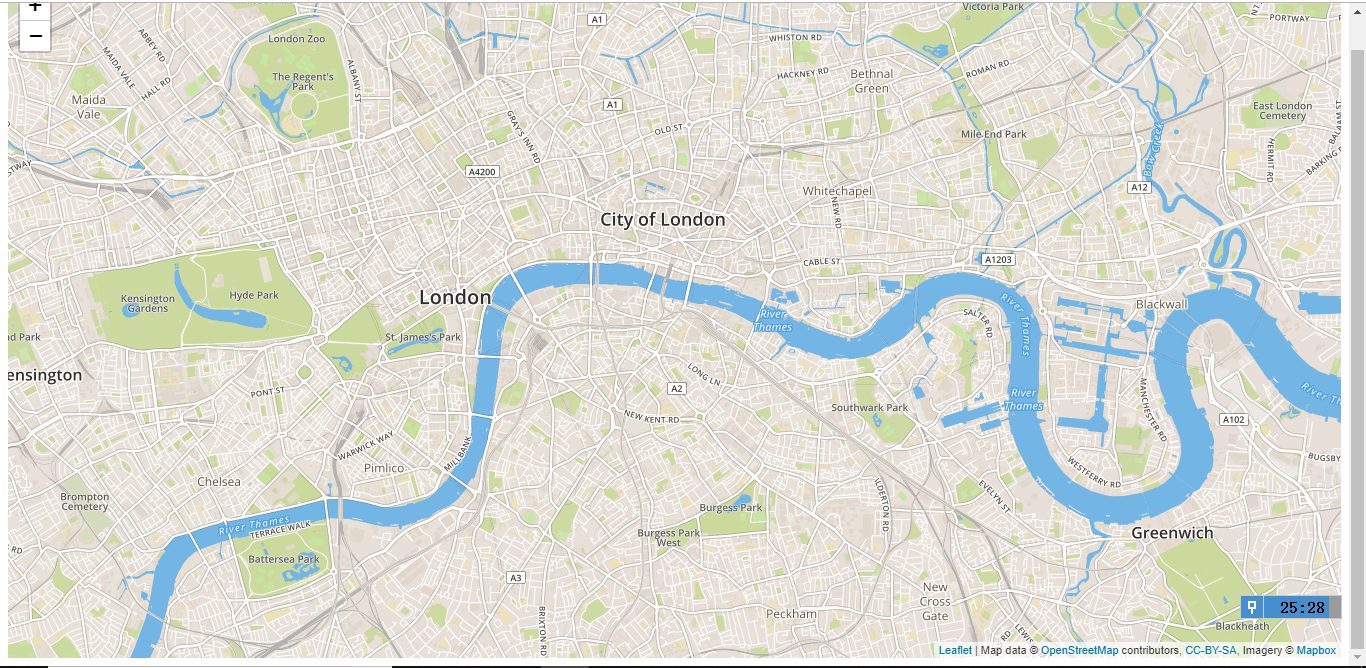
接下来可以分别添加点(Marker)线和面。
// Add markers
var marker = L.marker([51.5, -0.09]).addTo(mymap);

// Add circles
var circle = L.circle([51.508, -0.11], {
    color: 'red',
    fillColor: '#f03',
    fillOpacity: 0.5,
    radius: 500
}).addTo(mymap);

// Add polygons
var polygon = L.polygon([
    [51.509, -0.08],
    [51.503, -0.06],
    [51.51, -0.047]
]).addTo(mymap);
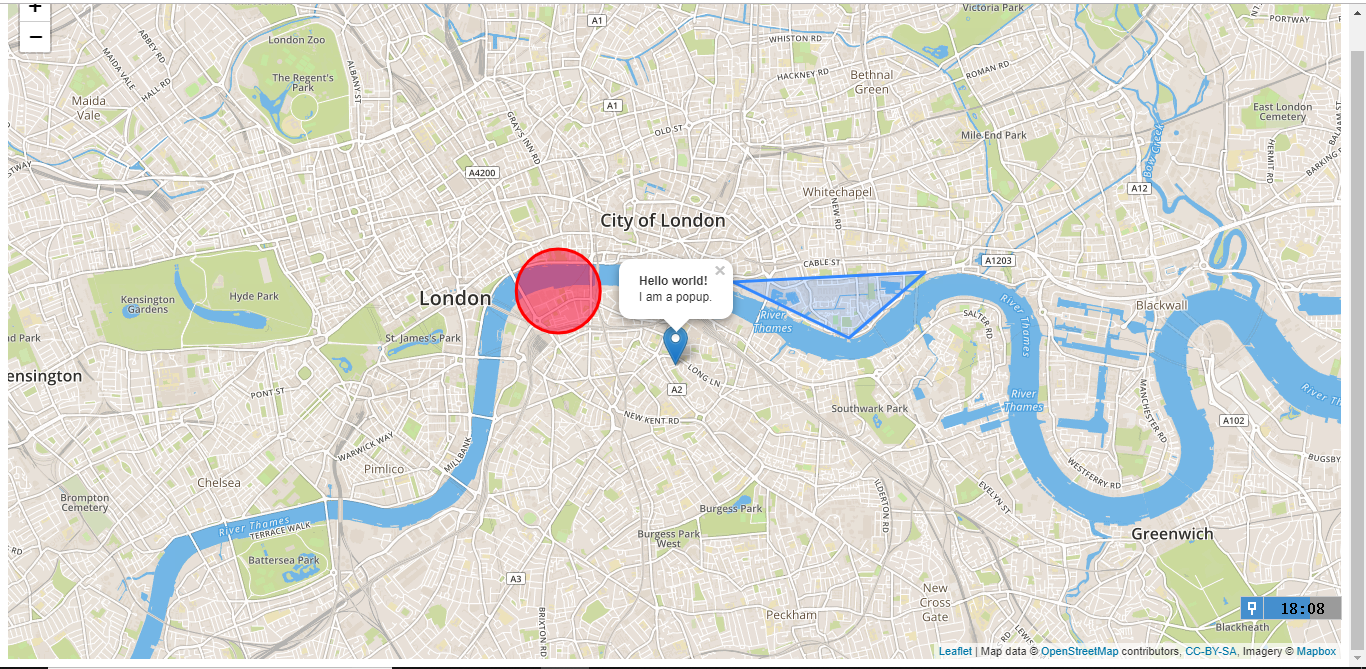
效果如下图所示。

对于具体的要素和图层,点击后可以跳出对话框,具体效果如下。
// Add popups for features
marker.bindPopup("<b>Hello world!</b><br>I am a popup.").openPopup();
circle.bindPopup("I am a circle.");
polygon.bindPopup("I am a polygon.");

// Add popups for layer
var popup = L.popup()
    .setLatLng([51.5, -0.09])
    .setContent("I am a standalone popup.")
    .openOn(mymap);
接下来,如果想要鼠标点击地图则显示具体的经纬度,可以添加事件。鼠标点击地图时执行该事件。
// Add events
function onMapClick(e) {
    popup
        .setLatLng(e.latlng)
        .setContent("You clicked the map at " + e.latlng.toString())
        .openOn(mymap);
}

mymap.on('click', onMapClick);

全部代码请查看tutorial.js文件。
加载GeoJSON要素
接下来将要介绍加载GeoJSON数据的方法。
GeoJSON是一种常见的GIS数据格式,即利用JSON文件存储地理数据。
我们首先定义一个GeoJSON数据。
// Define geojson features
var geojsonFeature = {
    "type": "Feature",
    "properties": {
        "name": "Coors Field",
        "amenity": "Baseball Stadium",
        "popupContent": "This is where the Rockies play!"
    },
    "geometry": {
        "type": "Point",
        "coordinates": [-104.99404, 39.75621]
    }
};
接下来加载入地图中。
// Add the geojson features to the map layer
L.geoJSON(geojsonFeature).addTo(mymap2);
显示效果如下图。

类似的,可以添加线和面,并设置其样式。
// Define line features
var myLines = [{
    "type": "LineString",
    "coordinates": [[-100, 40], [-105, 45], [-110, 55]]
}, {
    "type": "LineString",
    "coordinates": [[-105, 40], [-110, 45], [-115, 55]]
}];

// Define the style of the lines
var myStyle = {
    "color": "#ff7800",
    "weight": 5,
    "opacity": 0.65
};

// Add to the layer
L.geoJSON(myLines, {
    style: myStyle
}).addTo(mymap2);

// Define polygon features including styles
var states = [{
    "type": "Feature",
    "properties": {"party": "Republican"},
    "geometry": {
        "type": "Polygon",
        "coordinates": [[
            [-104.05, 48.99],
            [-97.22,  48.98],
            [-96.58,  45.94],
            [-104.03, 45.94],
            [-104.05, 48.99]
        ]]
    }
}, {
    "type": "Feature",
    "properties": {"party": "Democrat"},
    "geometry": {
        "type": "Polygon",
        "coordinates": [[
            [-109.05, 41.00],
            [-102.06, 40.99],
            [-102.03, 36.99],
            [-109.04, 36.99],
            [-109.05, 41.00]
        ]]
    }
}];

// Add to layer
L.geoJSON(states, {
    style: function(feature) {
        switch (feature.properties.party) {
            case 'Republican': return {color: "#ff0000"};
            case 'Democrat':   return {color: "#0000ff"};
        }
    }
}).addTo(mymap2);
此外,还可以设置一些属性,如显示与否等。全部代码请查看GitHub中tutorial.js文件.
效果如下图:

如果需要调用外部文件数据,而不是构造点线面要素的geoJSON,可以使用AJAX+jQuery进行调用。方法是设置AJAX读取文件格式为json,在回调函数中将数据显示出来。具体代码如下:
// Load data
var loadData = function (){
$.ajax("data/MegaCities.geojson", {
dataType: "json",
success: function(response){
geojsonFeature = response;
var geojsonMarkerOptions = {
radius: 8,
fillColor: "#ff7800",
color: "#000",
weight: 1,
opacity: 1,
fillOpacity: 0.8
};
L.geoJSON(response, {
pointToLayer: function (feature, latlng){
return L.circleMarker(latlng, geojsonMarkerOptions);
},
onEachFeature: onEachFeature
}).addTo(mymap);
}
});
}
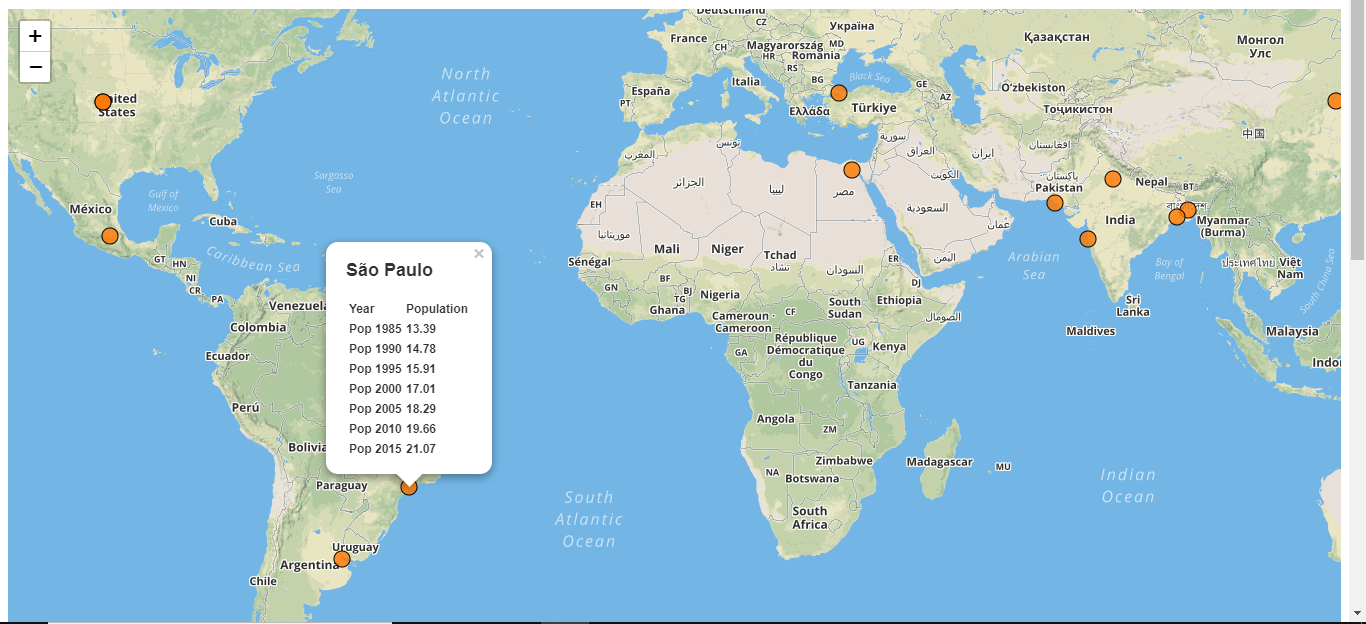
loadData();
最终效果如下图:
所有的代码请参见github: https://github.com/kkyyhh96/WebGIS
其中Leaflet文件夹下的index.html文件。欢迎Star和Fork!
1.搭建简易Web GIS网站:使用GeoServer+PostgreSQL+PostGIS+OpenLayers3
2.使用GeoServer+QGIS发布WMTS服务
3.使用GeoServer+OpenLayers发布和调用WMTS、Vector Tile矢量切片服务
4.Leaflet入门:添加点线面并导入GeoJSON数据