This Technical Bulletin discusses the troubleshooter architecture and what is available and shipped as a part of Exchange 2010 SP1 as well as troubleshooter that can be provided as a add on the product
Exchange 2010 SP1:
Troubleshooters
Contents
How Troubleshooters can be invoked 2
State Diagram for a Troubleshooter 3
Troubleshooters in Exchange 2010 SP1 4
Content Index (CI) Troubleshooter 4
Database Latency Troubleshooter 10
Database Disk Space Troubleshooter 14
Tech Bulletin Archive and Subscription Information 18
Troubleshooter Architecture
Troubleshooters are a relatively new concept in Windows, introduced in Windows7. They are a standard way to do problem determination and resolution in Windows that are specifically intended to make problem determination and resolution much more turn-key for users. The idea is that a user can run a troubleshooter for a given broad problem area and rely on the troubleshooter to find and fix most issues in that area. Running a troubleshooter against a healthy system should find no problems and hence do nothing.
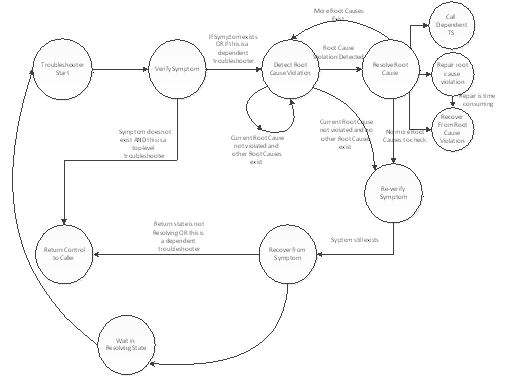
Root cause resolution in a troubleshooter consists of 3 parts:
- Detection: Identifying that there is a problem that needs to be resolved
- Resolution: Taking an action to recover from or repair the problem
- Verification: Checking whether the problem that had been detected and went through resolution has been fixed
The act of resolving a problem in one component may mean calling a troubleshooter for a dependent component. The called troubleshooter will then go through the same sequence of detect/resolve/verify for each root-cause it is aware of. In this way, troubleshooters can be chained to aid in isolating a problem down to its root cause.
How Troubleshooters can be invoked
There are a few different scenarios in which troubleshooters need to be invoked
- Admin Detected Problem: An admin could notice an issue or someone could report an issue into an admin, who then manually runs the troubleshooter for the issue. If the troubleshooter is able to detect and resolve the root cause, all is well. Otherwise, the troubleshooter must tell the admin if (a) it found an issue and was unable to correct it OR (b) did not find an issue
- Monitoring Detected Problem: The monitoring system in an Exchange environment (SCOM or any monitoring) is responsible for detecting operational problems. When such a problem is found, the monitoring system raises an alert. In addition, it should call into the appropriate troubleshooter. If the troubleshooter is able to detect and resolve the root cause, it must tell the monitoring system to resolve the alert. Otherwise, the troubleshooter must escalate the most specific problem it could find to the person who can act on the problem.
- All is well check: An admin can invoke the troubleshooter for the component and hope that it finds no problems. If it does and cannot resolve them, the admin has an early indication of an impending problem
State Diagram for a Troubleshooter
Troubleshooters in Exchange 2010 SP1
Exchange 2010 Service Pack 1 ships with the following troubleshooters:
- Content Index Troubleshooter (Troubleshoot-CI.ps1)
- Database Latency Troubleshooter (Troubleshoot-DatabaseLatancy.ps1)
- Database Disk Space troubleshooter (Troubleshoot-DatabaseSpace.ps1)
All of the troubleshooters are located under \program files\Exchange Server\V14\Scripts and are PowerShell scripts that can be invoked by the Exchange Admin or a monitoring program.
Content Index (CI) Troubleshooter
The CI troubleshooter (Troubleshoot-CI.ps1) is provided as a troubleshooter to detect and perform troubleshooting on Content Index (CI) catalogs. This troubleshooter is designed to detect and resolve the following symptoms
- Deadlock: Exchange Search deadlocks waiting on threads from MSSearch.
- Corruption: The search indexes are corrupted.
- Stall: This is similar to a deadlock; in this case the indexes are not getting updated.
- Backlog: The search catalog is backlogged resulting in missing index searches.
The troubleshooter will perform the requested operation on a server/database and can be used to detect as well as resolve the symptoms. The troubleshooter can also be used along with monitoring software to log warning or failure events in the application log.
Parameters
Server: The simple NETBIOS name of mailbox server on which troubleshooting should be attempted for CI catalogs. If this optional parameter is not specified, the local server is assumed.
Database: This is the name of the database to troubleshoot. If this optional parameter is not specified, catalogs for all databases on the server specified by the Server parameter are used.
Symptom: Specifies the symptom to detect and troubleshoot.
Possible values are:
- Deadlock
- Corruption
- Stall
- Backlog
- All (default)
Note: When 'All' is specified, all symptoms listed above are performed
Action: This specifies the action to be performed to resolve a symptom.
The possible values are:
- Detect (default)
- DetectAndResolve
- Resolve
MonitoringContext: This specifies if the command is being run in a monitoring context. The possible values are $true and $false (default). If the value is $true, warning/failure events are logged to the application event log.
FailureCountBeforeAlert: This specifies the number of failures the troubleshooter will allow before raising an Error in the event log, leading to a System Center Operations Manager (SCOM) alert. The allowed range for this parameter is 1-100, and the default is 3. No alerts are raised if the MonitoringContext is $false.
FailureTimeSpanMinutes: This specifies the number of minutes in the time span during which the troubleshooter will check the history of failures to count the failures and send an alert. If the failure count during this time span exceeds the value for FailureCountBeforeAlert, an alert is raised. The default value for this parameter is 600 minutes. No alerts are raised if MonitoringContext is $false.
Examples
Detects and reports if there is any problem with catalog for database DB01.
Does not attempt any Resolution.
C:\PS> .\Troubleshoot-CI.ps1 –database DB01
Detects if indexing on catalog for database DB01 is stalled.
Does not attempt any Resolution.
C:\PS> .\Troubleshoot-CI.ps1 –database DB01 –symptom Stall
Detects and reports problems with all catalogs on server S001, if any.
Does not attempt any Resolution.
C:\PS> .\Troubleshoot-CI.ps1 –Server <S001>
Detects and reports if there are any problems with the catalog for database DB01.
Attempts a Resolution of the problem.
C:\PS> .\Troubleshoot-CI.ps1 –database DB01 –Action DetectAndResolve
Attempts a Resolution action for catalog corruption for database DB01.
C:\PS> .\Troubleshoot-CI.ps1 –database DB01 –Symptom Corruption –Action Resolve
Running in a verbose mode will give more details
C:\PS> .\Troubleshoot-CI.ps1 -Database "Mailbox Database 153517792" –verbose
VERBOSE: Server= Database=Mailbox Database 1535177924 Symptom=All Action=Detect MonitoringContext=False FailureCountBeforeAlert=3 FailureTimeSpanMinutes=600
VERBOSE: Log-Event called with id=5000 type=Information message=The Troubleshooter started successfully.
VERBOSE: The Troubleshooter started successfully.
VERBOSE: MonitoringContext was false or the event is crimson-only, so skipped logging event
VERBOSE: Found 1 databases on CONCLTMBX1
VERBOSE: In function Get-CIStatus
VERBOSE: Now populating concltmbx1
VERBOSE: In Populate-CounterTable concltmbx1
VERBOSE: Adding value for \\concltmbx1\msexchange search indices(mailbox database 1535177924)\age of the last notification indexed
VERBOSE: Adding value for \\concltmbx1\msexchange search indices(_total)\age of the last notification indexed
VERBOSE: Adding value for \\concltmbx1\msexchange search indices(mailbox database 1535177924)\time since last notification was indexed
VERBOSE: Adding value for \\concltmbx1\msexchange search indices(_total)\time since last notification was indexed
VERBOSE: Adding counters for server concltmbx1
VERBOSE: hashKeyPrefix=\\concltmbx1\msexchange search indices(Mailbox Database 1535177924)\
VERBOSE: In function Get-CatalogHealthRegKey
VERBOSE: Get-MailboxDatabase Mailbox Database 1535177924
VERBOSE: checking bad block issues only after 09/01/2010 11:12:44
VERBOSE: Check-BadDiskBlocks did not find any msftesql crashes in event log since 09/01/2010 11:12:44
VERBOSE: CIStatus.HealthTimestamp = 09/01/2010 11:42:35
VERBOSE: current time = 09/01/2010 11:42:46
VERBOSE: Health status for Mailbox Database 1535177924\CONCLTMBX1 last modified at 09/01/2010 11:42:35
Name IsDeadLocked CatalogStatusArray
---- ------------ ------------------
CONCLTMBX1 False {Mailbox Database 1535177924\CONCLTM...
VERBOSE: Log-Event called with id=5003 type=Information message=The troubleshooter didn't find any catalog issues for database %1.
VERBOSE: The troubleshooter didn't find any catalog issues for database Mailbox Database 1535177924.
VERBOSE: MonitoringContext was false or the event is crimson-only, so skipped logging event
VERBOSE: Log-Event called with id=5002 type=Information message=The troubleshooter didn't find any issues for any catalog.
VERBOSE: The troubleshooter didn't find any issues for any catalog.
VERBOSE: MonitoringContext was false or the event is crimson-only, so skipped logging event
VERBOSE: Log-Event called with id=5001 type=Information message=The troubleshooter finished successfully.
VERBOSE: The troubleshooter finished successfully.
VERBOSE: MonitoringContext was false or the event is crimson-only, so skipped logging event
Event Log
If the monitoring context is enabled then the troubleshooter will log the following events in the Application log for a successful run:
Log Name: Application
Source: CI Troubleshooter
Event ID: 5000
Task Category: (1)
Level: Information
Keywords: Classic
Computer: CONCLTMBX1.contoso.com
Description:
The Troubleshooter started successfully
Log Name: Application
Source: CI Troubleshooter
Event ID: 5003
Task Category: (1)
Level: Information
Keywords: Classic
Computer: CONCLTMBX1.contoso.com
Description:
The troubleshooter didn't find any catalog issues for database Mailbox Database 1535177924.
Log Name: Application
Source: CI Troubleshooter
Event ID: 5002
Task Category: (1)
Level: Information
Keywords: Classic
User: N/A
Computer: CONCLTMBX1.contoso.com
Description:
The troubleshooter didn't find any issues for any catalog.
Log Name: Application
Source: CI Troubleshooter
Event ID: 5001
Task Category: (1)
Level: Information
Keywords: Classic
User: N/A
Computer: CONCLTMBX1.contoso.com
Description:
The troubleshooter finished successfully.
The troubleshooter will log events in the application log as well as under the crimson log under Microsoft-Exchange-Troubleshooters/Operational for some events:
Event# | Type | Descriptions |
5000 | Informational | The Troubleshooter started successfully. |
5001 | Informational | The troubleshooter finished successfully. |
5002 | Informational | The troubleshooter didn't find any issues for any catalog |
5003 | Informational | The troubleshooter didn't find any catalog issues for database %1. |
5004 | Informational | Restart of search services succeeded |
5005 | Informational | Reseeding succeeded for the catalog of database %1. |
5300 | Warning | Detected search service deadlock. |
5301 | Warning | Detected catalog corruption for database %1 |
5302 | Warning | Detected indexing stall for database %1 |
5600 | Error | The troubleshooter failed with exception %1. |
5601 | Error | The troubleshooter detected the symptom %1 %2 times in the past %3 hours for catalog %4. This exceeded the allowed limit for failures. |
5602 | Error | Search services failed to restart. Reason: %1 |
5603 | Error | Reseeding failed for the content index catalog of mailbox database %1. Reason: %2 |
5604 | Error | Indexing backlog reached a critical limit of %2 hours or more for database %1 |
5605 | Error | Another instance of the troubleshooter is already running on this machine. Two or more instances cannot be run simultaneously. |
Events logged only to crimson (windows) event log | ||
6000 | Informational | The troubleshooter started detection. |
6001 | Informational | The troubleshooter finished detection |
6002 | Informational | The troubleshooter started resolution. |
6003 | Informational | The troubleshooter finished resolution. |
6600 | Error | The troubleshooter failed during detection. |
6601 | Error | The troubleshooter failed during reosolution. Reason: %1 |
Sample Script
The Troubleshoot-CI.ps1 can also be used as part of another PowerShell script to detect and resolve a potential issue.
In this case we are checking for Stall symptoms:
$servers= get-mailboxserver Servername*
while($true)
{
foreach ($server in $servers)
{
.\Troubleshoot-CI.ps1 -verbose -server $server.Name -Action:DetectAndResolve -Symptom:Stall
}
sleep 14440
Database Latency Troubleshooter
The Database Latency Troubleshooter (Troubleshoot-DatabaseLatency.ps1) is provided as a troubleshooter to detect and perform troubleshooting on database latency. The troubleshooter is designed to detect for database latency for the following causes:
- Disk latency
- Active Directory Latency
- RPC Latency
- Top user
Note: The troubleshooter will run against the local mailbox database only.
Disk Latency
The troubleshooter detects disk latency by checking the following counters on the mailbox server database it is running against:
\MSExchange Database ==> Instances($database)\I/O Database Reads Average Latency
\MSExchange Database ==> Instances($database)\I/O Database Reads/sec
\MSExchange Database ==> Instances($database)\I/O Database Writes Average Latency
\MSExchange Database ==> Instances($database)\I/O Database Writes/sec
Note: The troubleshooter will take into account that the disk latencies are not caused by a heavily loaded disk subsystem.
It uses the following default thresholds:
- Maximum latency threshold for disk read is 200 reads average latency
- Minimum read rate for disk is 20 reads/sec
- Minimum write rate for disk is 20 writes/sec
Active Directory Latency
The troubleshooter detects Active Directory latency by checking the following counters on the mailbox server:
\MSExchangeIS\dsaccess average latency
\MSExchangeIS\dsaccess active call count
Note: Active Directory Latency check is currently not enabled in the troubleshooter
RPC Latency
The troubleshooter detects the RPC latency by checking the following performance counters on the mailbox server for the database it is running against
\MSExchangeIS Mailbox($database)\rpc average latency
\MSExchangeIS Mailbox($database)\RPC Operations/sec
It uses the following default thresholds:
- The Maximum RPC Average Latency default is set to 70
- The Maximum RPC Operations/sec Threshold default is set to 50
Top user
The troubleshooter detects the top CPU user by generating a descending list of the users using up the most time in server for a given database. It uses the output of Get-StoreUsageStatistics to get the MailboxGuid and the time in server used up during the captured sampling periods (10 min). If the Quarantine is enabled, the troubleshooter will log an event and quarantine the top CPU user.
Parameters
The following parameters are provided as a part of the Database Latency troubleshooter:
MailBoxDatabaseName: The Mailbox database the troubleshooter will run against. This is a mandatory parameter
LatencyThreshold: The maximum RPC average latency the server should be experiencing. The allowed range for this parameter is 1-200, and the default is 70.
Quarantine: Whether or not to quarantine heavy users, by default it doesn't quarantine the heavy user
TimeInServerThreshold: Sets the threshold for the top users that are causing the CPU starvation. The valid range is from 1-600000, default is 60000
MonitoringContext: Specifies whether the results of the command include monitoring events to be written in the regular application logs in Event Viewer and in the Operations log.
Using Troubleshoot-Database.ps1
Troubleshoot-Databaselatency.ps1 -MailboxDatabaseName <DatabaseID> [-latencyThreshold <1-200>] [-TimeinServerThreshold <1-600000>] [-Quarantine <switch>] [-MonitoringContext <switch>]
Example
C:\PS> .\Troubleshoot-DatabaseLatency.ps1 -MailboxDatabaseName "Mailbox Database 1395312077" -verbose –MonitoringContext
VERBOSE: Log-Event called with id=5110 type=Information message=The database latency troubleshooter started on database
%1.
VERBOSE: The database latency troubleshooter started on database Mailbox Database 1395312077.
VERBOSE: Log-Event called with id=5712 type=Error message=The database latency troubleshooter detected high RPC Average
latencies for database %1 but was unable to determine a cause. Manual intervention is required.
RPC Average Latency: %2
VERBOSE: The database latency troubleshooter detected high RPC Average latencies for database Mailbox Database
1395312077 but was unable to determine a cause. Manual intervention is required.
RPC Average Latency: 0
Error MM/DD/YYYY HH:MM:SS AM/PM Database Latency Troubleshooter 5712 (1)
Information MM/DD/YYYY HH:MM:SS AM/PM Database Latency Troubleshooter 5110 (1)
Log Name: Application
Source: Database Latency Troubleshooter
Event ID: 5712
Task Category: (1)
Level: Error
Keywords: Classic
Computer: CONDALMBX1.contoso.com
Description:
The database latency troubleshooter detected high RPC Average latencies for database Mailbox Database 1395312077 but was unable to determine a cause. Manual intervention is required.
RPC Average Latency: 0
Event Log
The following events are logged by Database Latency Troubleshooter
Event# | Type | Descriptions |
5110 | Informational | The database latency troubleshooter started on database %1 |
5111 | Informational | The database latency troubleshooter detected that the current latency of %1 ms for database %2 is within the threshold of %3 ms. |
5411 | Warning | The database latency troubleshooter quarantined user %1 on database %2 due to unusual activity in the mailbox. If the problem persists, manual intervention will be required. \nAverage time in server: %3 \nRPC Average Latency: %4 |
5412 | Warning | The database latency troubleshooter identified a problem with user %1 on database %2 due to unusual activity in the mailbox. No quarantine has been performed since the Quarantine parameter wasn't specified. If the problem persists, manual intervention is required. \nAverage time in server: %3 \nRPC Average Latency: %4 |
5710 | Error | The database latency troubleshooter detected that disk latencies are abnormal for database %1. You need to replace the disk. \nRead Latency: %2 \nRead Rate: %3 \nRPC Average Latency: %4 |
5711 | Error | The database latency troubleshooter detected that DSAccess latencies are abnormal for database %1. This may be due to an Active Directory problem. \nDSAccess Latency: %2 \nActive Calls: %3 \nRPC Average Latency: %4 |
5712 | Error | The database latency troubleshooter detected high RPC Average latencies for database %1 but was unable to determine a cause. Manual intervention is required. \nRPC Average Latency: %2 |
Database Disk Space Troubleshooter
The Database Disk Space Troubleshooter (Troubleshoot-DatabaseSpace.ps1) is provided as a troubleshooter to detect and perform troubleshooting on database disk space issues. The troubleshooter is designed to detect the database disk space availability and the cause for database log generation.
The Database Disk Space Troubleshooter:
- Tracks the top users that are generating transaction logs
- Tracks the available disk space for both logs and database
Based on a disk space and time threshold, the troubleshooter has the option to Quarantine the top users.
Parameters
MailboxDatabaseName: Specifies the mailbox database on which you are monitoring the log growth.
Server: Specifies the mailbox server on which you are monitoring the log growth for all mailbox databases.
Note: You can't combine the Server and MailboxDatabaseName parameters.
Note: One of these two parameters (Server or MailboxDatabaseName) is required.
PercentEdbFreeSpaceThreshold: Percentage of disk space for the EDB file at which Exchange should begin quarantining users. The allowed range for this parameter is 1-99, default is 25
PercentLogFreeSpaceThreshold: Specifies the percentage of disk space for the log files at which Exchange should begin quarantining users. The allowed range for this parameter is 1-99, default is 25
HourThreshold: Specifies the number of hours that you can wait until running out of space. The allowed range for this parameter is 1-1,000,000,000, default is 12 hours.
MonitoringContext: Specifies whether the results of the command include monitoring events to be written in the regular application logs in Event Viewer and in the Operations log.
Quarantine: Specifies that heavy users will be quarantined
Using Troubleshoot-Database.ps1
The following parameter syntax set and table lists the parameters that you can use to monitor specific mailbox databases.
Troubleshoot-DatabaseSpace.ps1 -MailboxDatabaseName <DatabaseID> [-PercentEdbFreeSpaceThreshold <1-99>] [-PercentLogFreeSpaceThreshold <1-99>] [-HourThreshold <1- 1000000000>] [-Quarantine <switch>] [-MonitoringContext <switch>]
Troubleshoot-DatabaseSpace.ps1 -Server <ServerID> [-PercentEdbFreeSpaceThreshold <1-99>] [-PercentLogFreeSpaceThreshold <1-99>] [-HourThreshold <1- 1000000000>] [-Quarantine <switch>] [-MonitoringContext <switch>]
Example
C:\PS> .\Troubleshoot-DatabaseSpace.ps1 -MailboxDatabaseName "Mailbox Database 1395312077" -verbose –MonitoringContext
VERBOSE: Log-Event called with id=5100 type=Information message=The database space troubleshooter started on volume %1for database %2.
VERBOSE: The database space troubleshooter started on volume C:\ for database Mailbox Database 1395312077.
VERBOSE: Event source Database Space Troubleshooter doesn't exist on CONDALMBX1.contoso.com. Creating it.
VERBOSE: Current Growth Rate: 0
VERBOSE: Log-Event called with id=5101 type=Information message=The database space troubleshooter finished on volume %1 for database %2. No problems were detected.
EDB drive free space: %3 B
Log drive free space: %4 B
EDB free space threshold: %5%
Log free space threshold: %6%
Hour threshold: %7 hrs
Current growth rate: %8 B/hr
VERBOSE: The database space troubleshooter finished on volume C:\ for database Mailbox Database 1395312077. No problems
were detected.
EDB drive free space: 117761335296 B
Log drive free space: 117760974848 B
EDB free space threshold: 0%
Log free space threshold: 0%
Hour threshold: 0 hrs
Current growth rate: 0 B/hr
Log Name: Application
Source: Database Space Troubleshooter
Event ID: 5100
Task Category: (1)
Level: Information
Keywords: Classic
Computer: CONDALMBX1.contoso.com
Description:
The database space troubleshooter started on volume C:\ for database Mailbox Database 1395312077.
Log Name: Application
Source: Database Space Troubleshooter
Event ID: 5101
Task Category: (1)
Level: Information
Keywords: Classic
Computer: CONDALMBX1.contoso.com
Description:
The database space troubleshooter finished on volume C:\ for database Mailbox Database 1395312077. No problems were detected.
EDB drive free space: 117761335296 B
Log drive free space: 117760974848 B
EDB free space threshold: 0%
Log free space threshold: 0%
Hour threshold: 0 hrs
Current growth rate: 0 B/hr
Event Log
The following events are logged by Database Latency Troubleshooter:
Event# | Type | Descriptions |
5100 | Informational | The database space troubleshooter started on volume %1 for database %2 |
5101 | Informational | The database space troubleshooter finished on volume %1 for database %2. No problems were detected. \nEDB drive free space: %3 B \nLog drive free space: %4 B \nEDB free space threshold: %5% \nLog free space threshold: %6% \nHour threshold: %7 hrs \nCurrent growth rate: %8 B/hr |
5400 | Warning | The database space troubleshooter finished on volume %1 for database %2. The database is over the expected threshold. Users were quarantined to avoid running out of space. \nEDB drive free space: %3 B \nLog drive free space: %4 B \nFree space threshold: %5% \nLog Free space threshold: %6% \nHour threshold: %7 Hrs \nGrowth rate threshold: %8 B/Hr \nInitial growth rate: %9 B/Hr \nFinal growth rate: %10 B/Hr \nNumber of users quarantined %11 |
5401 | Warning | The database space troubleshooter finished on volume %1 for database %2. The database is over the expected threshold, but is not growing at an unusual rate. No action was taken. \nEDB drive free space: %3 B \nLog drive free space: %4 B \nFree space threshold: %5% \nLog Free space threshold: %6% \nHour threshold: %7 Hrs \nGrowth rate threshold: %8 B/Hr \nInitial growth rate: %9 B/Hr \nFinal growth rate: %10 B/Hr |
5410 | Warning | The database space troubleshooter quarantined mailbox %1 in database %2. |
5700 | Error | The database space troubleshooter finished on volume %1 for database %2. The database is over the expected threshold and continues to grow. Manual intervention is required. \nEDB drive free space: %3 B \nLog drive free space: %4 B \nFree space threshold: %5% \nLog Free space threshold: %6% \nHour threshold: %7 Hrs \nGrowth rate threshold: %8 B/Hr \nInitial growth rate: %9 B/Hr \nFinal growth rate: %10 B/Hr \nNumber of users quarantined %11
|
5701 | Error | The database space troubleshooter detected a low space condition on volume %1 for database %2. Provisioning for this database has been disabled. Database is under %3% free space.
|
5702 | Error | The database space troubleshooter has detected a critically low space condition on volume %1 for database %2. Provisioning for this database has been disabled. The database has less than %3% free space.
|
References
Manage Database Latencies by Using the Troubleshoot-DatabaseLatency.ps1 Script in the Shell
http://technet.microsoft.com/en-us/library/ff798271.aspx
Manage Database Log Growth by Using the Troubleshoot-DatabaseSpace.ps1 Script in the Shell
http://technet.microsoft.com/en-us/library/ff477617.aspx
Exchange 2010 SP1: The Troubleshooters
http://blogs.technet.com/b/exchange/archive/2011/01/18/3411844.aspx
Credits
Thanks to Nasir Ali for writing this Technical Bulletin and to Ben Winenz for Technical Review.
Tech Bulletin Archive and Subscription Information
To subscribe to Exchange Technical Bulletins please follow this link:
http://AutoGroup/JoinGroup.asp?GroupAlias=exchtb
Find older Exchange Technical Bulletins at:
http://sharepoint/sites/ecske/techbulletins
or
\\nbtools\Share\Exchange_Technical_Bulletins
Publicly available Bulletins:
http://technet.microsoft.com/en-us/library/bb187471(EXCHG.80).aspx