对于给定的一张图像,可能边缘或者无效信息较多,所以需要将图像主要内容分离出来,这里对于特定的图片给出一个小例子。


对于此图(左)来说,两边的无效信息较多,字母主要集中在中间部分。对于少量图而言可以手动去掉两边的空白成为右图。可是对于成千上万张图片需要一种特定的方法。观察到数字主要集中在中间并且为大量黑色像素点,两边主要是白色像素点,所以考虑将图片先转为灰度,然后统计其水平的像素值分布,根据一定的阈值将中间部分区分出来。
import cv2
import os
import numpy as np
import matplotlib.pyplot as plt


imgs = os.listdir(r"D:/ws_yzm/yzm/valid_data")
imgNum = len(imgs)
img =[[] for i in range(imgNum)]
for i in range(0, imgNum):
    img[i] = cv2.imread('yzm/valid_data/'+imgs[i])
    img[i] = cv2.cvtColor(img[i], cv2.COLOR_BGR2GRAY)   # 将读入的图像先转为灰度

img_wrong = cv2.imread('D:/ws_yzm/yzm/valid_data/'+'00264.png')  # 取其中的一张图片进行操作显示
img_wrong= cv2.cvtColor(img_wrong, cv2.COLOR_BGR2GRAY)

y_axis = np.mean(img_wrong, axis=0)  # 对图片的水平方向求象素均值
b = y_axis.shape[0]
y_t = np.zeros(b)
plt.subplot(221)
plt.plot(y_axis)  # 画出水平像素分布

for i in range(0, b):
    if y_axis[i] <= 200:  # 设定阈值为200,即水平像素均值<200则令y_t为1,否则为0
        y_t[i] = 1

plt.subplot(222)
plt.plot(y_t)  # 将y_t画出

y_diff = np.diff(y_t) # 对y_t求差分
plt.subplot(223)
plt.plot(y_diff)  # 将y_diff画出

q = np.where(y_diff != 0) # 将y_diff!=0的点坐标找出
q = list(q[0])
q.append(b)
axis = [] # 存放找到的区间坐标

for l in range(1, q.__len__()):
    if (((q[l] - q[l - 1]) > 25) & (y_t[q[l] - 1] == 1)):
        axis.extend([q[l - 1], q[l]])  # 将区间宽度>25,并且属于值为1的区间坐标找出

if axis and np.max(axis) >= 200:  # 如果找出的坐标非空,且其最大值>200则在axis里找出最大和最小坐标值
    x_min = np.min(axis)
    x_max = np.max(axis)
else:                             # 如果找出的坐标为空,则取图像最右端0为左边界,q的最小值为有边界
    x_min = 0
    x_max = np.min(q)

plt.subplot(224)
img_new = img_wrong[:, x_min:x_max]  # 将处理后的图像画出

#cv2.imwrite('yzm/new_valid_data/' + imgs[j], img_new)
plt.imshow(img_wrong[:, x_min:x_max], cmap='gray')
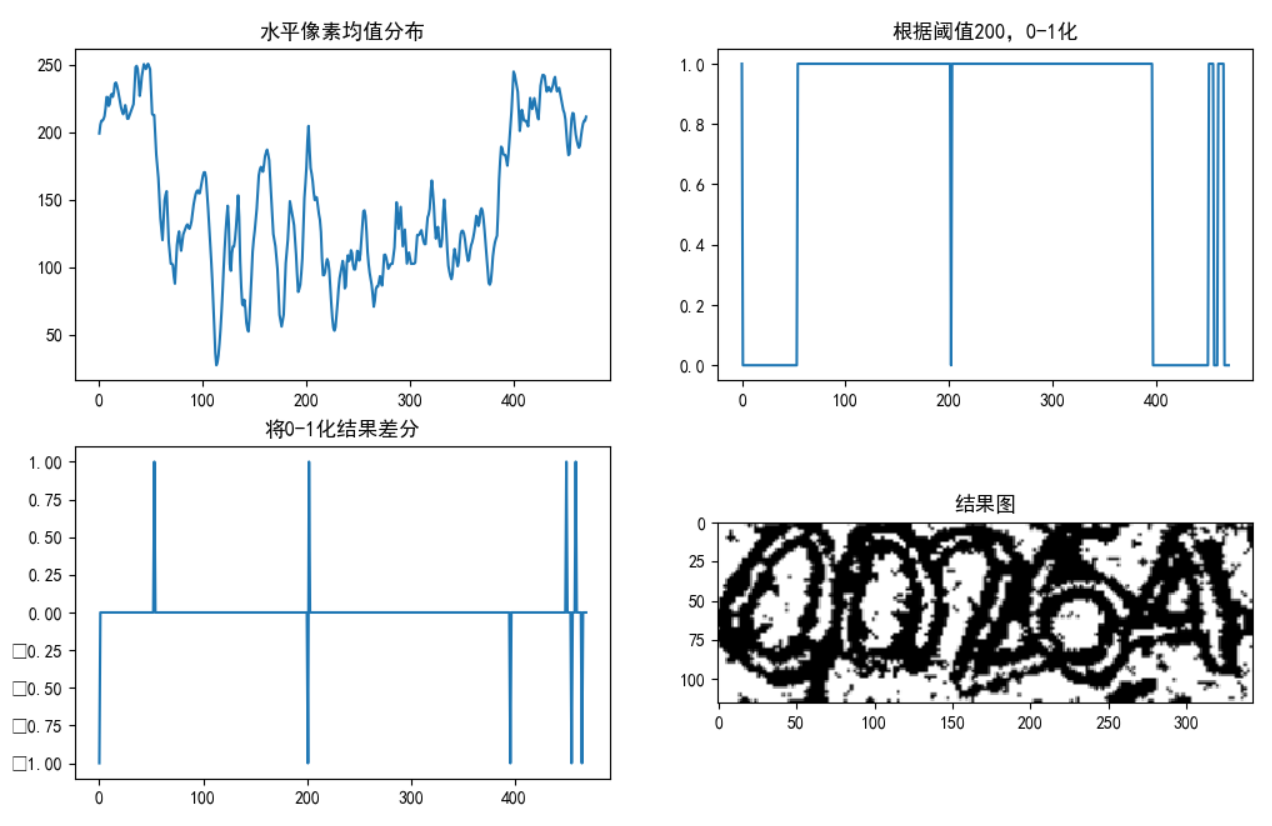
由结果图看到分割较好。条件设置主要是针对0-1二值化的结果,由于数字分布不均匀,不同的图0-1化结果有很大出入,所以需要根据一定的判断将x_min和x_max求出。上述代码在几千张的图像处理中基本都能分割正确。