如何使用d3来解析自定义格式的数据源?
var psv = d3.dsvFormat("|");
// This parser can parse pipe-delimited text:
var output = psv.parse("first|last
abe|lincoln")
console.log(output[0])
// 将输出以下内容:
=> {first: "abe", last: "lincoln"}
这样我们通过js filereader获取文件内容,之后通过上面的代码格式化就能形成javascript的对象以供我们使用
javascript以及D3中的数组操作方法
在javascript中对数组的操作总体上分为两类:一种是mutation的也就是执行对应函数后原数组将会被修改,一种是accessor,就是返回源数组的部分数据,不会对原数组做任何的修改。
mutation类的函数有:
array.reverse, array.splice, array.shift, array.unshift, array.sort
accessor类的函数有
array.concat, array.indexOf, array.join, array.lastIndexOf, array.slice
d3库中数组操作相关的函数有:
d3.min, d3.max, d3.sum,d3.mean, d3.extent(获取最大最小值并形成一个数组)
d3.median
D3数据可视化基础pattern:
var svg = d3.select("body").append("svg").attr("width", diamter).attr("height",diameter).attr("class","bubble");
svg.select/.selectAll
.data
.enter
.append
d3.select
d3.select selects only the FIRST MATCHING ELEMENT that lives in the document
d3.selectAll
d3.selectAll selects ALL MATCHING Elements in the document.
d3 selections的结果是包含dom数组的数组,而这个数组除了javascript的native函数功能外,d3还定义了新的array处理函数可以对这些selection结果进行特殊操作
select elements by:
1. tags - "div", "span"
2. class - ".inner-div",".outer-span", ".my-class-element"
3. id - "#id_of_my_element"
4. attribute, containment, union/intersection of selectors chosen
注意:部分老的浏览器对于CSS3定义的selector可能不支持,这时可以使用一个叫做sizzle的pure js工具
每一个selected elements lives in the selection array
d3.selection.append(name): append operator
append a new element with the specified named element as the last child in the each of the current selection, then returning the new selection with the new appended element.返回的就是新增的元素数组 (注意name可以是普通的html元素,也可以是svg图形类:rect, circle,ellapse, polyline,polygon等等)
另外需要注意的是:如果使用svg元素来做可视化,那么由于svg本身不像普通html元素属性那样适用document flow,像margin, padding等css属性在svg中是不起作用的,这样所有的svg元素都会一个一个地堆砌在一起,因此必须我们自己来通过设置svg元素的transform属性或者x,y,cx,cy,width等svg元素属性来自行调整元素在svg container中的position,也就是将数据绑定到svg并且应用到svg类似x,y,cx,cy,width的属性上,否则就将是一团堆叠在一起的东西
d3.selection.insert(name, (before)) : insert operator
insert a new element with the specified name before the element the before selector matching element, 如果before selector没有匹配的selection,则会作为append operator使用
d3.selection.remove(): remove operator
对selection执行remove操作,从dom中去除
SVG VS canvas
SVG: vector based矢量图,可无损无限放大, SVG本身就在DOM中,可以针对局部css修饰,比较适合简单的几何图形, SVG元素可以接受js event api
Canvas: raster based数位图, canvas可以用js绘制出复杂的图形
D3使用svg来绘制图形

d3.selection.attr(name [,value]).attr(name [,value]) attr operator
对所有selection中的element设置属性
d3.selection.style(name [,value][,priority]) style operator
虽然d3可以非常方便地使用链式函数调用,但是这带来另外一个问题是代码很难理清哪些被select了,操作了哪些属性。而幸运的是,由于d3的以下特性使得这个问题易于解决:
1. d3在javascript之上,那么js的所有特性都能在d3中使用
2. 几乎everything都是一个selection
3. 返回的selection那么可以赋值给js变量

d3.selection.data([values[,key]) :d3 data operator
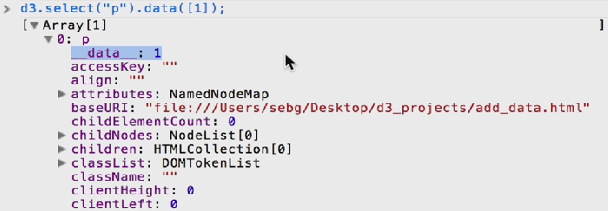
上面提过d3会对selection数组及元素提供很多扩展的函数或者属性,其中非常重要的一点就是__data__属性,一旦执行了下面的代码 d3.select("p").data([1])则就会对所有的p元素绑定上数据1,在console中你可以看到__data__属性就创建了并且设置为1
d3.select("p").data([function returnThree(){return 3;}])
d3.select("p").data([ superWoman = {"gender": "female","transportation": "fly"}])
d3.selectAll("p").data([1,2]) =>这个两个p元素selection分别绑定1和2这两个数据!~
d3.selectAll("p").data([[1,2,3],[4,5,6]) =>这个两个p元素selection分别绑定[1,2,3]和[4,5,6]这两个数组!~
d3.selectAll("p").data([function returnThree(){return 3;},function returnFour(){return 4;}]) 这个两个p元素selection分别绑定returnThree和returnFour两个函数
d3.selectAll("p").data([ superWoman = {"gender": "female","transportation": "fly"},superMan = {"gender": "male","transportation": "ICE"}])
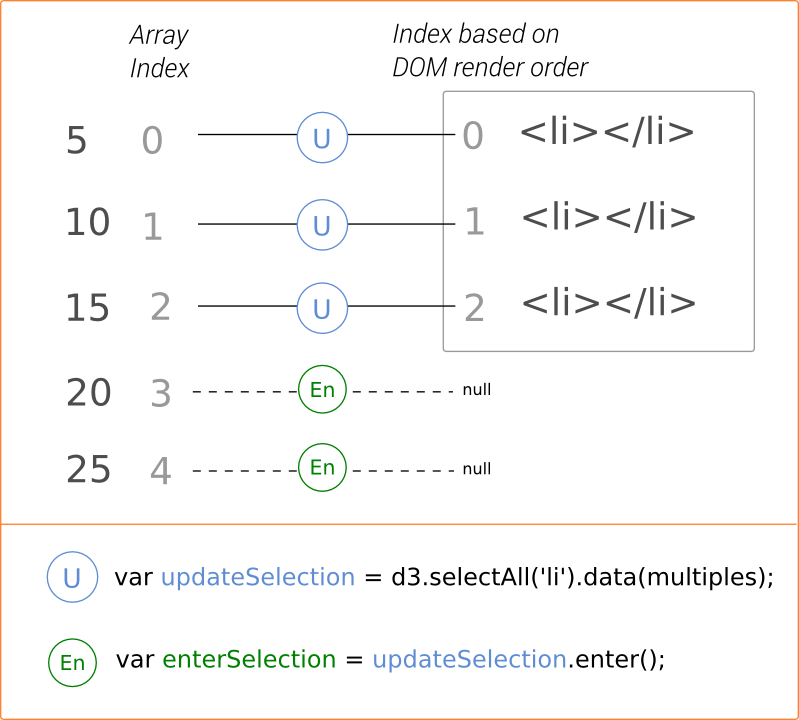
如果data数据个数和selection的元素个数不匹配会出现什么情况?
d3.select("body").insert("p");
d3.select("body").insert("p");
// 两个p插入body
d3.selectAll("p");//将返回两个p
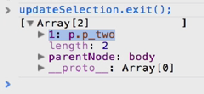
d3.selectAll("p").data([1]); // selection数量大于数据个数: 这时只有第一个p元素被绑定了数据1,并且返回的selection中只包含这个p!!!
// 也就是返回已经成功绑定了数据的selection,而没有绑定数据的第2个p则存在于上述selection的exist selection中, 如下右图所示,一般接着就应该是remove()掉
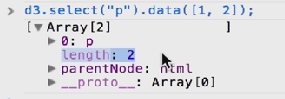
d3.select("p").data([1,2]); // 数据个数大于selection的元素个数, 这时第一个元素被绑定为1,那么第二个数据2如何体现呢?
// 这时selection将返回两个元素(其中一个为Placeholder,存在于enter selection中,一般紧接着就是append创建元素并绑定placeholder的数据),
// 但是由于只存在一个元素,所以并没有第二个元素存在于selection中,但是selection的length为2,这个就是指示还可以继续append元素,如下左图所示
上面的data函数将dom和数据join起来,如果data是一系列的objects数组,则可以传入第二个参数key用于指定用到数据的哪一个字段来绑定
d3 update selection = de3.select("p").data(xx)返回的selection
返回前面的selection中成功绑定了数据的实体elements,同时该update selection可以跟着enter,exit来访问也包含了enter, exit两个selection分别对应未绑定数据的实体元素和已绑定数据的placeholder元素

https://bost.ocks.org/mike/join/
d3 exit selection: d3.selectAll("p").data([1]) (两个p只给一个数据)
d3.select("body").insert["p"].attr("class","p_one");
d3.select("body").insert["p"].attr("class","p_two");
var updateSelection = d3.select("body").selectAll("p").data([1]);
// 注意updateSelection只返回成功绑定了数据的p_one元素
updateSelection.exit(); // 注意这个exit selection包含p_two元素(没有绑定数据的)
只能紧跟在.data()返回的update selection后面使用, prior selection没有成功绑定数据的elements
一句话: exit selection返回prior selection中还没有绑定数据的实体元素
d3 enter selection:
返回prior selection中还没有绑定数据的placeholder元素, enter selection只定义了append, insert,select operator,一旦这三个operator中的任何一个使用了,你就可以修改select的content了
d3.select("body").insert["p"].attr("class","p_one");
var updateSelection = d3.select("body").select["p"].data([1,2]);
// 返回绑定了数据的第一个p元素
updateSelection.enter();
// 返回placeholder元素(还没有绑定数据的placeholder)


https://bost.ocks.org/mike/selection/
https://bost.ocks.org/mike/constancy/
Binding data to dom elements
我们来回顾一下基本的pattern: d3.selectAll('div').data([yy] ).enter().append('div')
首先选择根本不存在的'div',通过data operator绑定(join)数据,通过enter获取到这些placeholder元素(js object),随后通过append operator实际生成这些div,注意这时每个实体的div都将继承enter selection中placeholder元素的数据
d3.selection.text([value/function]) d3 text operator
设置html元素的textContent属性为value,value可以是常量,也可以返回string的函数。对于传入function的情况,这个function对selection中的所有元素都会分别被调用,并且在该function中可以访问该元素绑定的data
callback函数的可用参数
d- the __data__ property
i- the element index
this- the DOM reference to the element in question
var fivePData = d3.select("body").selectAll("p").data([1,2,3,4,5]).enter().append("p");
function textFunc (d,i){ return "data is" + d + " and index is: " +i;}
fivePdata.text(textFunc);
// 上面的代码将产生5个p元素,并且将p元素的textContent设置为包含对应数据的title
selection.style(name [, value][,priority]) style operator
var myData = [1,2,3,4,5];
var svgViewport = d3.select("body").append("svg").attr("width","400").attr("height","300");
var circleSelection = svgViewport.selectAll("circle").data(myData)
var circleElements = circleSelection.enter().append("circle");
function greenRed(d,i){
  if(i%2===0){return "green";}else{return "red";}
}
var circleStyle = circleElements.style("fill",greenRed);
// 上面的代码对奇数和偶数个数circle应用不同颜色
SVG basic shapes
rect,:x,y,width,height
circle,: cx,cy,r
ellipse,: cx,cy,rx,ry
straight line,: x1,y1,x2,y2,stroke,stroke-width
polyline,: stroke,stroke-width,points
<svg width="50" height="50">
  <polyline
       stroke="blue" stroke-width="2"
       points="05,30 15,30 15,20 25,20" />
</svg>
polygon, :fill,stroke,stroke-width,points
<svg width="50" height="50">
  <polygon
       fill="yellow"
       stroke="blue" stroke-width="2"
       points="05,30 15,30 15,20 25,20" />
</svg>
从上面的polyline和polygon可以看出稍稍复杂一点的graph都会有很繁琐的point数据来描述的,随着图像复杂度增大,如何维护polyline中的这个points属性值将是一个噩梦,幸运的是由于svg path可以产生任意的graph,而d3又可以通过path generator来为我们自动产生path所需要的d属性字符串,从而替我们来处理这些琐碎无聊的工作。
path: svg path is the shape to make all shapes
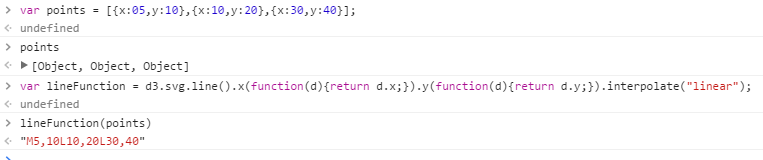
上面的例子中lineFunction对points数组变换成了path的d属性。
但是问题是:d3js v4好像没有了svg函数??!===>d3 v4已经全部使用了扁平的命名方式,不用再使用d3.svg.line了,取而代之的是d3.line了!
下图列出通过svg path来画出rect,circle,line这几种最常见的svg shape方法来:

注意cx,cy,r数据都是unit而不是px, svg的width,height也是以unit为单位的,而非px,因此在svg中非常重要的一点是scale,比例尺
coordinates in svg vs math

注意svg元素中的任何子元素其x,y,cx,cy等都是相对于其container元素的坐标系的
<svg width="300" height="200" style="
    stroke: aliceblue;
    stroke- 1px;
    border: 1px solid;
">
        <rect x="0" y="0" width="50" height="50" style="fill:green"></rect>
        <g transform="translate(100,30)">
            <rect x="0" y="0" width="100" height="100" style="fill:blue"></rect>
            <text x="15" y="58" fill="White" font-family="arial" font-size="16">
                In the box
            </text>
        </g>
    </svg>
上面的代码中rect, text的x,y都是相对于g元素的哦!而g元素又做了transform:translate如下图

注意:svg中没有类似css中的z-index的概念,在后面的元素总会覆盖前面的元素,要实现类似z-index的概念,我们必须在render之前对selection做好排序!
d3js by examples: https://bl.ocks.org/d3byex
d3 key, values,entries utility function

SVG Path Mini-Language
-moveto
-lineto
-horizontal lineto
-vertical lineto
-curveto
-smooth curveto
-quadratic bezier curveto
-smooth quadratic bezier curveto
-elliptical arc
-closepath
D3 Path Data Generator
上面提到通过svg path mini language来做svg path我们可以画出任何简单或者复杂的图形来,但是要维护这个path的数据简直就是一个灾难,不过好在d3可以帮助我们简化这个工作,上面也提到过通过line generator来生成path所需要的d参数,下面我们详细看看d3中提供了哪些个path generator
D3 path data generator functions
d3.svg.line
d3.svg.line.radial
d3.svg.area
d3.svg.area.radial
d3.svg.arc
d3.svg.symbol
d3.svg.chord
d3.svg.diagonal
d3.svg.diagonal.radial
D3 associative Array Utilities
d3.keys(object) : 返回一个对象的字典数组
d3.values(object):返回一个对象所有key对应的value
d3.entries(object): 返回key/value pair 对象数组
给svg container 添加坐标轴
d3.select("body").append("svg").attr("width",200)
    .attr("height",200).append("g").call(d3.svg.axis())
d3 scale for data and axis:
到底什么是scale呢?按照d3作者的说法
"
If visualization is constructing “visual representations of abstract data to amplify cognition”, then perhaps the most important concept in D3 is the scale, which maps a dimension of abstract data(domain) to a visual variable(range)
"
也就说scale用来将抽象数据的一个纬度映射成一个可视域的变量。那么什么又是数据的一个纬度呢?什么又是可视域变量呢?
对于一个execel表格数据来说,每一row行可以被认为是一个vector向量,而每一column列就可以被认为是一个纬度。比如价格,销售额等
而visual variables可以这样理解: how graphical marks(比如散列图中的一个dot)can represent data using planar position(x,y)和一个多变的z纬度
在 Semiology of Graphics 这本符号图形理论书籍中,作者这样举例:
"
在一个平面里,一个mark可以在上面或者下面,左面或者右面。人类的眼睛能够感知到独立正交的x和y两个纬度。而mark本身光学能量则产生了一个完全独立于x和y的z纬度.
人眼是敏感的,在这个和光学相关的z纬度,又可以分解为6个独立的visual variables可以叠加在x,y平面上: the size of the marks, their value, texture, color, orientation, and shape.他们可以代表diffrences(≠)不同, similarities(≡)相似,a quantified order(Q),或者a nonquantified order(O),and can express groups, hierachies,or vertical movements.
"

根据上面的理论,我们可以得出下面的实例化定义:
"
Thus, a scale is a function that takes an abstract value of data, such as the mass of a diamond in carats, and returns a visual value such as the horizontal position of a dot in pixels. With two scales (one each for x and y),(y轴可以拿对应的price做映射) we have the basis for a scatterplot.
"
scale就是将input domain映射成为range的函数
The input domain is an interval in the abstract dimension of data, often the extent of the observed values. The output range is an interval in the visual variable, such as the visible area defined by the chart size
d3js built-in支持以下种类的scale

quantitative scales: d3.scale.linear() : for continuous input domains, such as numbers: y=kx+b
d3.scale.linear().domain([0,100]).range([0,1]).clamp(true) // 对于input数据不在domain这个范围时,只取其最靠近的range,比如linearfunction(500)也只能返回1
sequential scale:
var rainbow = d3.scaleSequential(function(t) {
  return d3.hsl(t * 360, 1, 0.5) + "";
}).range([0,1]);
rainbow(0) // "rgb(255, 0, 0)"
rainbow(0.1) // rgb(255, 153, 0)"
threashold scale:
var color = d3.scaleThreshold()
    .domain([0, 1])
    .range(["red", "white", "green"]);

color.invertExtent("red"); // [undefined, 0]
color.invertExtent("white"); // [0, 1]
color.invertExtent("green"); // [1, undefined]
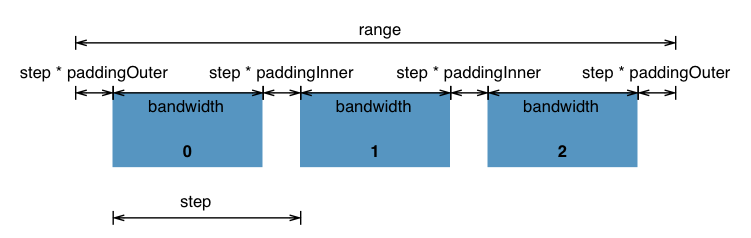
Band Scale:
var bands = d3.scaleBand().domain([0,1,2]).range([0,100]).round(true)
bands.paddingOuter()
// 0
bands.bandwidth()
// 33
bands(1)
//34
bands(2)
//67
bands(0)
//1
PointScale

Quantize scale
注意如果希望将连续的domain映射成离散的output输出,需要使用scaleQuantize,而不是scaleLinear (注意这些是d3js v4的api,而d3 v3则对应是d3.scale.linear)
var quantizescale = d3.scaleQuantize().domain([0,100]).range(["red","white","green"])
quantizescale(10)
//"red"
quantizescale(60)
//"white"
quantizescale(80)
//"green"
quantizescale(20)
//"red"
quantizescale.invertExtent('white')
// [33.333333333333336, 66.66666666666667]
quantizescale.invertExtent('red')
// [0, 33.333333333333336]
quantizescale.invertExtent('green')
// [66.66666666666667, 100]
ordinal scale: 离散的数据: d3.scale.ordinal().domain([values]).range([values]) for discrete input domains, such as names or categories
rangePoints()
.rangeBands(interval[,padding[,outerPadding]])
.rangeRoundBands
柱状图应该使用scaleBand
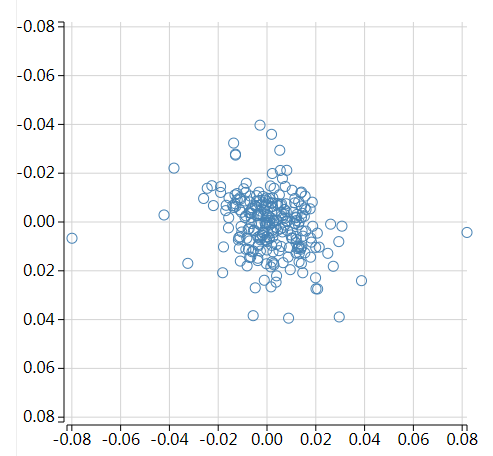
scatter plot散布图可以呈现三维信息,其中圆radius应该使用 rScale = d3.scaleSqrt() (//因为是平方的关系)
v4 api中应该使用d3.scaleOrdinal = d3.scale.ordinal (V3 api)
time scale: for time domain
Scale完成的工作是将domain映射为range,它就是一个函数,可以被应用在axis上

var myScale = d3.scale.linear().domain([0,10]).range([0,200]);
var myAxis = d3.svg.axis().scale(myScale);
var mySVG = d3.select("body").append("svg").attr("width",200).attr("height",200);
var axisGroup = mySVG.append("g").call(myAxis);
scale.invert函数返回反向计算的结果:给定一个range值,返回对应的domain值
linear scale
methods:
sqrt
A square root scale.
pow
A power scale (good for the gym, er, I mean, useful when working with exponential
series of values, as in “to the power of ” some exponent).
log
A logarithmic scale.
Other Methods | 119
quantize
A linear scale with discrete values for its output range, for when you want to sort
data into “buckets.”
quantile
Similar to quantize, but with discrete values for its input domain (when you already
have “buckets”).
ordinal
Ordinal scales use nonquantitative values (like category names) for output; perfect
for comparing apples and oranges.
d3.scale.category10(), d3.scale.category20(), d3.scale.category20b(), and
d3.scale.category20c()
Handy preset ordinal scales that output either 10 or 20 categorical colors.
d3.
take into account the margin arrangement
上面的一段代码通过svg container append一个group element,在这个g元素selection中直接调用myAxis函数创建坐标轴,这时axis都是紧挨着svg conatiner的边缘的,因此部分数据会由于不在svg container的viewport中而无法显示。如何解决这个问题?d3给了标准的方案:
var margin = {top: 50, right: 50, bottom: 50, left: 50},
    width = 300-margin.left-margin.right,
    height = 300-margin.top-margin.bottom
var myScale = d3.scale.linear().domain([0,10]).range([0,width]);
var myAxis = d3.svg.axis().scale(myScale).orient("bottom"); // 默认就是bottom orientation,文字在轴的下面
var mySVG = d3.select("body").append("svg").attr("width",width+margin.left+margin.right).attr("height",height+margin.top+margin.bottom).append("g").attr("transform","translate("+margin.left+","+margin.top+")");
var axisGroup = mySVG.append("g").call(myAxis);

d3 axis orientation with x轴,y轴及margin convention
上面我们定义并创建了axis,但是坐标轴上的文字在轴的上面?下面?左面?右面?以及这个轴是在上面下面左面右面,横向或者纵向?这个是怎么定义的呢?答案是由axis的.orient来定义文字和轴的相对方向,而由transform来将轴整体移动到上下左右不同的角落
d3.svg.axis().orient([orientation)
"top": 位置在最上面,自左往右横向,文字也在轴的上面
"left":位置在最左面,自上往下纵向,文字也在轴的左边
"right":位置在最左面,自上往下纵向,文字在轴的右面
"bottom":位置在最上面,自左往右横向,文字在轴的下面
一个svg元素container设置为viewport,其widht,height设置为包含margin-top,left,
chart area则由一个g元素来做容器包裹,该g元素通过transform对应margin来实现和viewport之间的间距
var margin = {top: 50, right: 50, bottom: 50, left: 50},
    width = 300-margin.left-margin.right,
    height = 300-margin.top-margin.bottom
var myScale = d3.scale.linear().domain([0,10]).range([0,width]);
var myXAxis = d3.svg.axis().scale(myScale).orient("top");
var myYAxis = d3.svg.axis().scale(myScale).orient("left");
var mySVG = d3.select("body").append("svg").attr("width",width+margin.left+margin.right).attr("height",height+margin.top+margin.bottom).append("g").attr("transform","translate("+margin.left+","+margin.top+")");
// 需要注意的是g元素只是作为一个container元素来使用,其大小是有其内部元素来决定的,也就是auto的,由于g没有width,height属性,因此不能通过设置widht,height来指定大小

var axisX = mySVG.append("g").call(myXAxis);
var axisY = mySVG.append("g").call(myYAxis);
上面的代码将产生以下坐标

d3 scale for data
我们通过scale应用到axis创建的过程后,坐标轴就实现了domain 到 range的自动映射,但是这时我们创建visual component时,比如bar chart的高度如果直接传入绑定的domain数据,那么我们看到的结果并不会如我们预期,这时也必须应用axis相同的scale function.我们也需要更多地考虑和决定到底哪些data需要应用这个scale,比如bubble chart我们可能只对bubble所在的x,y坐标使用scale,而bubble circle的直径要么使用未经过scale变换的真实数据,要么我们可能需要定义另外一个scale function来专门应用到这个circle radius的值变换上去。
elementAttributes = elements.attr(...,function(d,i){return scaleFunction(d)})
                                               .attr(...,function(d,i){return d.r})
                                               .attr(...,function(d,i){return anotherScaleFunc(d)})
// 这个例子中我们依据绑定的真实数据对svg内的elements属性做映射设置时部分使用原数据,
// 部分使用一个scaleFunc,部分使用另外的scaleFunction
// 这个就需要我们仔细去思考和设计并决定哪些应该返回真实数据,哪些返回
d3.xhr(url[,mimeType][,callback(error,data)])) ajax functions to retrieve data from server
d3.xhr按照不同的mimeType又有幾個對應的子函数,如下:
d3.text
d3.html
d3.json
d3.xml
d3.csv
d3.tsv
javascript async/sync
javascript本身是single threaded运行模式的,如果某个js模块运行时间过长,那么整个页面就处于block状态,这对于从较慢的网络获取数据时尤其显得问题突出,javascript ajax技术的发明就是解决这个问题的。

使用selection.call(callback,additionalParameters)来梳理代码
function scaleSelected(selection, scale){
   selection.style('transform', 'scaleX(' + scale + ')');
}
var bar = d3.select('.chart').append('g').insert('rect').data(myData).enter().on('mouseout',function(d,i,elements){
  d3.select(this).call(scaleSelected,2).call(anothercallback);
// 注意call调用依然返回selection,这样就可以链式操作了
}
d3->d4最重大的变化
d4支持模块化,虽然默认的bundle基本上已经包含了30多个小的模块基本够用,但是我们也可以方便地使用扩展的其他模块,或者使用webpack打包出我们定制的包
d4 symbol都使用了扁平化,而不是以前的nested mode,比如d3.scale.linear = d3.scaleLinear, and d3.layout.treemap = now d3.treemap.
https://github.com/d3/d3/blob/master/CHANGES.md
chart creation steps
创建xScale,yScale:
var xScale = d3.scaleTime().domain([
d3.min(data,company=>d3.min(company.values,d=>d.date)),
d3.max(data,company=>d3.max(company.values,d=>d.date))])
=>创建axisBottom, axisLeft:
svg.append('g').attr('transform',`translate(0,${height})`).call(d3.axisBottom(xScale).ticks(5);
svg.append('g').call(d3.axisLeft(yScale);
=> svgcontainerselection.call(axisBottom)放置到container中, 创建line/path generator:
var line = d3.line().x(d=>xScale(d.date).y(d=>yScale(d.close)).curve(d3.curveCatmullRom.alpaha(0.5));,
selectAll('.line').data(data).enter().append('path').attr('class','.line').attr('d'=>line(d.values))
SVG responsive
var margin = { top: 10, right: 20, bottom: 30, left: 30 };
var width = 400 - margin.left - margin.right;
var height = 600 - margin.top - margin.bottom;

var svg = d3.select('.chart')
  .append('svg')
    .attr('width', width + margin.left + margin.right)
    .attr('height', height + margin.top + margin.bottom)
    .call(responsivefy)
  .append('g')
    .attr('transform', 'translate(' + margin.left + ', ' + margin.top + ')');

svg.append('rect')
  .attr('width', width)
  .attr('height', height)
  .style('fill', 'lightblue')
  .style('stroke', 'green');

var yScale = d3.scaleLinear()
  .domain([0, 100])
  .range([height, 0]);
var yAxis = d3.axisLeft(yScale);
svg.call(yAxis);

var xScale = d3.scaleTime()
  .domain([new Date(2016, 0, 1, 6), new Date(2016, 0, 1, 9)])
  .range([0, width]);

var xAxis = d3.axisBottom(xScale)
  .ticks(5)
  .tickSize(10)
  .tickPadding(5);
svg
  .append('g')
    .attr('transform', `translate(0, ${height})`)
  .call(xAxis);

function responsivefy(svg) {
  // get container + svg aspect ratio
  var container = d3.select(svg.node().parentNode),
      width = parseInt(svg.style("width")),
      height = parseInt(svg.style("height")),
      aspect = width / height;

  // add viewBox and preserveAspectRatio properties,
  // and call resize so that svg resizes on inital page load
  svg.attr("viewBox", "0 0 " + width + " " + height)
      .attr("preserveAspectRatio", "xMinYMid")
      .call(resize);

  // to register multiple listeners for same event type,
  // you need to add namespace, i.e., 'click.foo'
  // necessary if you call invoke this function for multiple svgs
  // api docs: https://github.com/mbostock/d3/wiki/Selections#on
  d3.select(window).on("resize." + container.attr("id"), resize);

  // get width of container and resize svg to fit it
  function resize() {
      var targetWidth = parseInt(container.style("width"));
      svg.attr("width", targetWidth);
      svg.attr("height", Math.round(targetWidth / aspect));
  }
}
d3js v3和v4中如何一次性获取和处理enter以及update selections统一处理相应逻辑?
在d3js中,我们已经很熟悉通过select.data().append().attr这种pattern来处理可视化,我们也知道data操作符调用后返回update selection并且通过update selection也可以访问exit和enter selection,这些selection加起来才是整个可视化的dom集合,在d3中无须任何其他调用,只要你执行了update.enter().append()之后enter selection自然就merge到update selection中去了,因此我们对update selection的任何操作都会影响到整个dom集。但是在v4中,这个特性消失了,取而代之的是必须使用merge调用。但是要注意的是通过merge获取到整个dom集合后,update段的数据更新(比如在.each函数中对每个数据dataum增加一个字段,而在其他地方使用该数据)在该场景下可能存在问题。
<html>
    <head>
        <script src="d3.v3.min.js"></script>
    </head>
    <body>
        <p>p1</p>
        <p>p2</p>
        <p>p3</p>
    </body>
</html>
var update = d3.select("body").selectAll("p").data([4,5,6,7,8])
update.enter().append("p");
update.text(function(d,i){return d}) // V3下一次调用就可以对所有5个dom元素执行操作
// 而v4下则必须使用merge函数调用,比如:
var update = d3.select("body").selectAll("p").data([4,5,6,7,8])
var enter = update.enter().append("p")
enter.merge(update).text(function(d){return d;}) // 一次调用text就可以对所有的selection设置对应数据了
常用数据可视化的图表种类及应用场景(从excel中梳理出来)

布局和路径生成器
布局的目的是生成便于绘制图形所需的数据,比如要绘制饼图就需要startAngle, endAngle,而输入的数据却只是一个类似[1,3,,5,2,32]的数组,因此要绘制必须将输入的数组转换为对应的[{startAngle:0,endAngle:20,data:1},{}...]的数组。
在得到适宜于绘图的数据后,还需要路径生成器,来生成最终绘图的svg图形,饼图一般就用弧生成器。
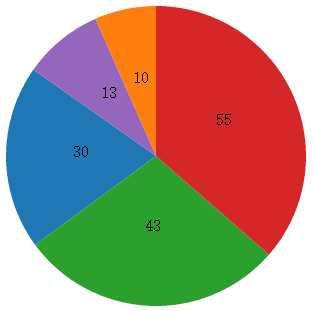

var dataset = [ 30 , 10 , 43 , 55 , 13 ];
var pie = d3.layout.pie();
var piedata = pie(dataset);
var outerRadius = 150; //外半径
var innerRadius = 0; //内半径,为0则中间没有空白

var arc = d3.svg.arc()  //弧生成器
    .innerRadius(innerRadius)   //设置内半径
    .outerRadius(outerRadius);  //设置外半径
var arcsg = svg.selectAll("g")
    .data(piedata)
    .enter()
    .append("g")
    .attr("transform","translate("+ (width/2) +","+ (width/2) +")");
arcsg.append("path")
    .attr("fill",function(d,i){
        return color(i);
    })
    .attr("d",function(d){
        return arc(d);   //调用弧生成器,得到路径值
    });
var color = d3.scale.category10();   //有十种颜色的颜色比例尺
arcsg.append("text")
    .attr("transform",function(d){
        return "translate(" + arc.centroid(d) + ")";
    })
    .attr("text-anchor","middle")
    .text(function(d){
        return d.data;
    });
如何创建带有刻度尺的图表?
最重要的思路是将那些横向和纵向的刻度当作axis的tick来处理。分别创建一个axisLeft和axisBottom但是transform到right和top,将tick的长度设置为图形的宽度和高度,将坐标轴上的数字隐藏起来
var yGridlinesAxis = d3.svg.axis().scale(scale).orient("left");
            var yGridlineNodes = svg.append('g')
                .attr('transform', 'translate(' + (margins.left + graphWidth) + ',' + margins.top + ')')
                .call(yGridlinesAxis.tickSize(graphWidth + axisPadding, 0, 0).tickFormat(""));
            styleGridlineNodes(yGridlineNodes);
function styleGridlineNodes(axisNodes) {
            axisNodes.selectAll('.domain')
                .attr({
                    fill: 'none',
                    stroke: 'none'
                });
            axisNodes.selectAll('.tick line')
                .attr({
                    fill: 'none',
                    'stroke-width': 1,
                    stroke: 'lightgray'
                });
        }