1 Python title() 方法返回"标题化"的字符串,就是说所有单词都是以大写开始,其余字母均为小写(见 istitle())
str.title()
2 类的继承
class Car():
    def __init__(self, make, model, year):
        self.make = make
        self.model = model
        self.year = year
        self.odometer_reading = 0

    def get_descriptive_name(self):
        long_name = str(self.year) + ' ' + self.make + ' ' + self.model
        return long_name.title()

    def read_odometer(self):
        print('This car has ' + str(self.odometer_reading) + ' miles on it.')


class ElectricCar(Car):
    def __init__(self, make, model, year):
        super().__init__(make, model, year)
        self.battery_size = 70

    def describe_battery(self):
        print("This car has a " + str(self.battery_size) + "-kWh battery.")
3 pd.read_csv()

4
meshgrid函数通常在数据的矢量化上使用,但是使用的方法我暂时还不是很明确。而meshgrid的作用适用于生成网格型数据,可以接受两个一维数组生成两个二维矩阵,对应两个数组中所有的(x,y)对。接下来通过简单的shell交互来演示一下这个功能的使用,并做一下小结。
交互显示:
In [65]: xnums =np.arange(4)
In [66]: ynums =np.arange(5)
In [67]: xnums
Out[67]: array([0,1, 2, 3])
In [68]: ynums
Out[68]: array([0,1, 2, 3, 4])
In [69]: data_list= np.meshgrid(xnums,ynums)
In [70]: data_list
Out[70]:
[array([[0, 1, 2,3],
[0, 1, 2, 3],
[0, 1, 2, 3],
[0, 1, 2, 3],
[0, 1, 2, 3]]), array([[0, 0, 0, 0],
[1, 1, 1, 1],
[2, 2, 2, 2],
[3, 3, 3, 3],
[4, 4, 4, 4]])]
In [71]: x,y =data_list
In [72]: x.shape
Out[72]: (5L, 4L)
In [73]: y.shape
Out[73]: (5L, 4L)
In [74]: x
Out[74]:
array([[0, 1, 2,3],
[0, 1, 2, 3],
[0, 1, 2, 3],
[0, 1, 2, 3],
[0, 1, 2, 3]])
In [75]: y
Out[75]:
array([[0, 0, 0,0],
[1, 1, 1, 1],
[2, 2, 2, 2],
[3, 3, 3, 3],
[4, 4, 4, 4]])
由上面的交互可以看出,meshgrid的作用是根据传入的两个一维数组参数生成两个数组元素的列表。如果第一个参数是xarray,维度是xdimesion,第二个参数是yarray,维度是ydimesion。那么生成的第一个二维数组是以xarray为行,ydimesion行的向量;而第二个二维数组是以yarray的转置为列,xdimesion列的向量。
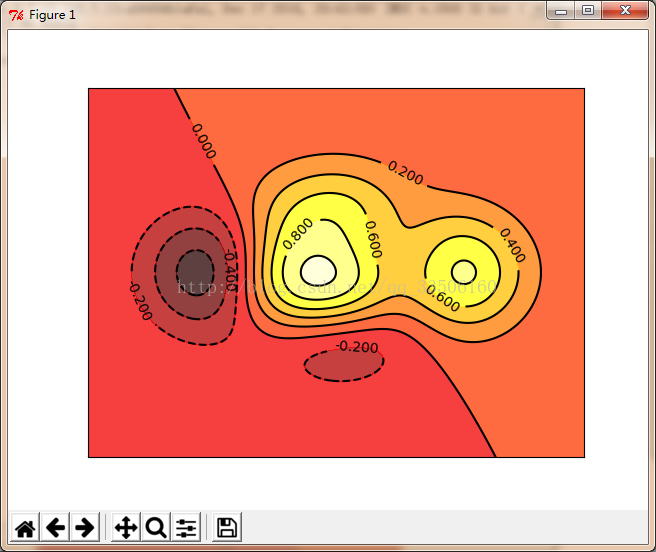
5
使用contour绘制等高线图形
import numpy as np
import matplotlib.pyplot as plt
def height(x,y):
    return (1-x/2+x**5+y**3)*np.exp(-x**2-y**2)
x=np.linspace(-3,3,300)
y=np.linspace(-3,3,300)
X,Y=np.meshgrid(x,y)
plt.contourf(X,Y,height(X,Y),10,alpha=0.75,cmap=plt.cm.hot)
#为等高线填充颜色 10表示按照高度分成10层 alpha表示透明度 cmap表示渐变标准
C=plt.contour(X,Y,height(X,Y),10,colors='black')
#使用contour绘制等高线
plt.clabel(C,inline=True,fontsize=10)
#在等高线处添加数字
plt.xticks(())
plt.yticks(())
#去掉坐标轴刻度
plt.show()
#显示图片
请使用手机"扫一扫"x