import matplotlib.pyplot as plt
import numpy as np
import pandas as pd
import seaborn as sns
%matplotlib inline
x = np.linspace(0, 10, 1000)
y = np.cos(x)
plt.plot(x, y, ls='-', lw=2, label='plot', color='y')
plt.legend()
<matplotlib.legend.Legend at 0x1ff814c6bb0>
y = np.random.randn(1000)
plt.scatter(x, y, label='random', c='c')
plt.xlim(0, 11)
plt.ylim(-10, 10)
t = [i for i in np.arange(0, 10, 0.5)]
plt.xticks(t, t)
plt.legend(loc=2)
<matplotlib.legend.Legend at 0x1ffa52916a0>
y = np.sin(x)
plt.plot(x, y, ls='--', lw=2, c= 'c', label='plot')
plt.legend()
plt.grid(linestyle=':', color='r')

plt.plot(x, y, ls='-', lw=2, c='c', label='plot')
plt.legend()
plt.axhline(y=0.0, c='r', ls='--', lw=2)
plt.axvline(x=4.0, c='r', ls='--', lw=2)
<matplotlib.lines.Line2D at 0x1ffa53dcd30>

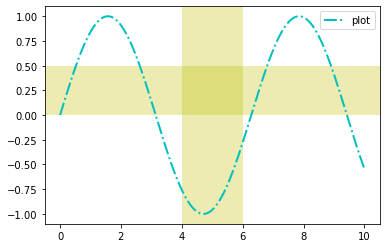
plt.plot(x, y, ls='-.', lw=2, c='c', label='plot')
plt.legend()
plt.axvspan(xmin=4.0, xmax=6.0, facecolor='y', alpha=0.3)
plt.axhspan(ymin=0.0, ymax=0.5, facecolor='y', alpha=0.3)
<matplotlib.patches.Polygon at 0x1ffa545cac0>
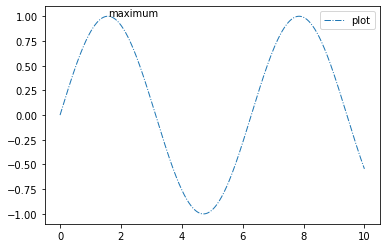
plt.plot(x, y, ls='-.', lw=1, label='plot')
plt.legend()
plt.annotate('maximum', xy=(np.pi/2, 1.0))
Text(1.5707963267948966, 1.0, 'maximum')
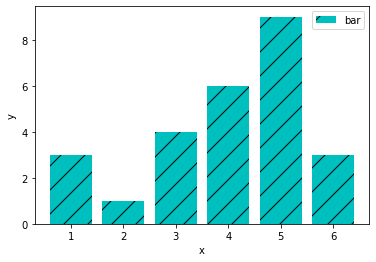
x = [1, 2, 3, 4, 5, 6]
y = [3, 1, 4, 6, 9, 3]
plt.bar(x, y, align='center', color='c', hatch='/', label='bar')
plt.legend()
plt.xlabel('x')
plt.ylabel('y')
Text(0, 0.5, 'y')
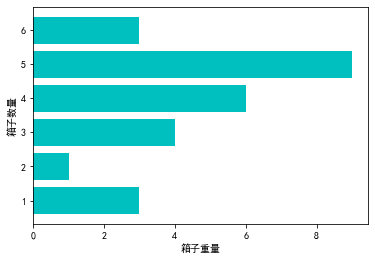
import matplotlib as mpl
mpl.rcParams['font.sans-serif'] = ['SimHei']
mpl.rcParams['axes.unicode_minus'] = False
plt.barh(x, y, align='center', color='c')
plt.xlabel('箱子重量')
plt.ylabel('箱子数量')
Text(0, 0.5, '箱子数量')
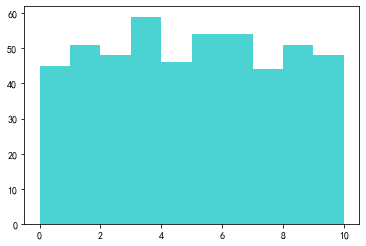
x = np.random.randint(0, 10, 500)
plt.hist(x, bins=np.arange(0, 11, 1), alpha=0.7, color='c')
(array([45., 51., 48., 59., 46., 54., 54., 44., 51., 48.]),
 array([ 0,  1,  2,  3,  4,  5,  6,  7,  8,  9, 10]),
 <BarContainer object of 10 artists>)
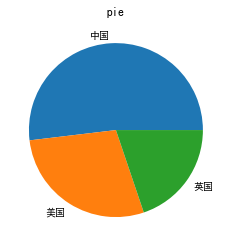
x = {'中国':7868, '美国':4292, '英国':3003}
s = pd.Series(x)
s.apply(lambda x: x/s.sum())
s.plot.pie(label='')
plt.title('pie')
plt.savefig('output.tif', dpi=600, pil_kwargs={'compression': 'tiff_lzw'})
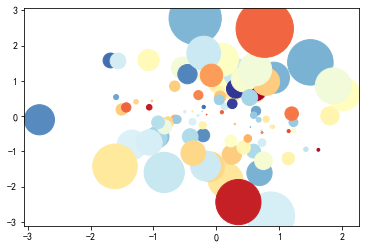
import random
a = np.random.randn(100)
b = np.random.randn(100)
plt.scatter(a, b, s=np.power(10*a+20*b, 2), c=np.random.randn(100), cmap=mpl.cm.RdYlBu, marker='o')
<matplotlib.collections.PathCollection at 0x1ffa5773fd0>
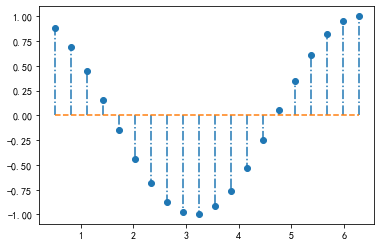
x = np.linspace(0.5, 2*np.pi, 20)
y = np.cos(x)
plt.stem(x, y, linefmt='-.', markerfmt='o', basefmt='--')
<StemContainer object of 3 artists>
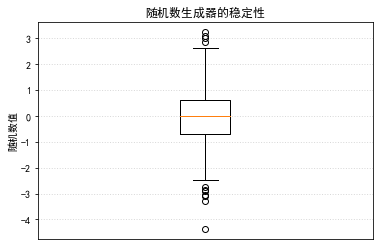
x = np.random.randn(1000)
plt.boxplot(x)
plt.xticks([3],['随机数生成器'])
plt.ylabel('随机数值')
plt.title('随机数生成器的稳定性')
plt.grid(axis='y', ls=':', lw=1, color='gray',alpha=0.3)
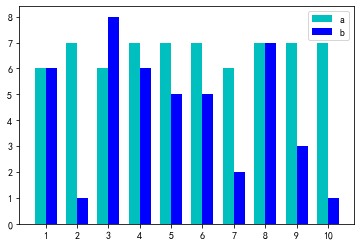
x = np.arange(1, 11, 1)
y = np.random.randint(6, 8, 10)
np.random.seed(916)
y1 = np.random.randint(1, 10, 10)
plt.bar(x, y, width=0.35, color='c', label='a')
plt.bar(x+0.35, y1, width=0.35, color='b', label='b')
plt.xticks(x+0.35/2, np.arange(1, 11, 1))
plt.legend()
<matplotlib.legend.Legend at 0x1ffa58f1070>
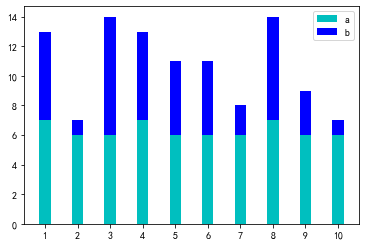
x = np.arange(1, 11, 1)
y = np.random.randint(6, 8, 10)
np.random.seed(916)
y1 = np.random.randint(1, 10, 10)
plt.bar(x, y, width=0.35, color='c', label='a')
plt.bar(x, y1, width=0.35, color='b', label='b', bottom=y)
plt.xticks(x, np.arange(1, 11, 1))
plt.legend()
<matplotlib.legend.Legend at 0x1ffa5893850>
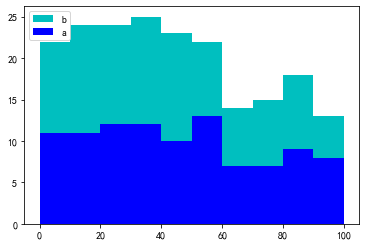
y = np.random.randint(1, 100, 100)
y1 = np.random.randint(1, 100, 100)
plt.hist([y, y1], stacked=True, histtype='stepfilled', rwidth=0.3, color=['b', 'c'], bins=np.arange(0, 101, 10), label=['a', 'b'])
plt.legend(loc='upper left')
<matplotlib.legend.Legend at 0x1ffa571e610>
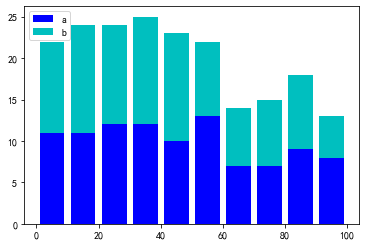
plt.hist([y, y1], stacked=True, histtype="bar",rwidth=0.8, color=['b', 'c'], bins=np.arange(0, 101, 10), label=['a', 'b'])
plt.legend(loc='upper left')
<matplotlib.legend.Legend at 0x1ffa5380490>
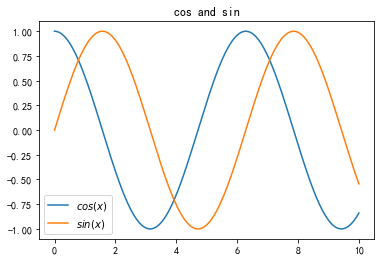
x = np.linspace(0, 10, 10000)
y = np.cos(x)
y1 = np.sin(x)
plt.plot(x, y, label=r'$cos(x)$')
plt.plot(x, y1, label=r'$sin(x)$')
plt.legend(loc=3)
plt.title('cos and sin')
Text(0.5, 1.0, 'cos and sin')
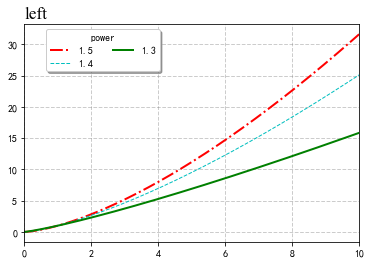
x = np.linspace(0, 10, 1000)
y = np.power(x, 1.5)
y1 = np.power(x, 1.4)
y2 =np.power(x, 1.2)
plt.plot(x, y, lw=2, ls='-.', c='r', label='1.5')
plt.xlim(0, 10)
plt.plot(x, y1, lw=1, ls='--', c='c', label='1.4')
plt.plot(x, y2, lw=2, ls='-', c='g', label='1.3')
plt.legend(loc='upper left', bbox_to_anchor=(0.05, 0.95, 0.95, 0.05), ncol=2, title='power', shadow=True, fancybox=True)
plt.title('left', loc='left', fontdict={'color':'black', 'family':'Times New Roman', 'size':'xx-large'})
plt.grid(ls='--', lw=1, color='gray', alpha=0.4)
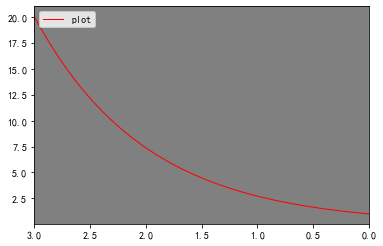
x = np.linspace(0, 3, 100)
y = np.exp(x)
plt.axes().set_facecolor('gray')
plt.plot(x, y, ls='-', lw=1, c='r',label='plot')
plt.legend(loc='upper left')
plt.xlim(3, 0)
(3.0, 0.0)
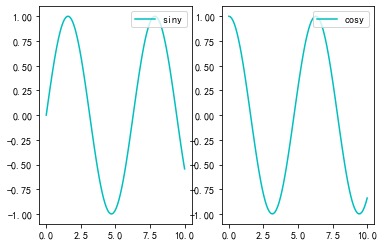
x = np.linspace(0, 10, 100)

siny = np.sin(x)
cosy = np.cos(x)

plt.subplot(121)
plt.plot(x, siny, label='siny', c='c')
plt.legend(loc=1)

plt.subplot(122)
plt.plot(x, cosy, label='cosy', c='c')
plt.legend(loc=1)
<matplotlib.legend.Legend at 0x1ffa6bdce80>
x = np.random.randn(100)
y = np.random.randn(100)
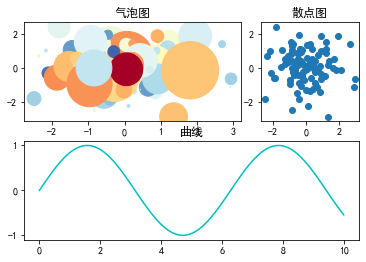
plt.subplot2grid((2, 3), (0, 0), colspan=2)
plt.scatter(x, y, s=np.power(10*a+20*b, 2), c=np.random.randn(100), cmap=mpl.cm.RdYlBu, marker='o')
plt.title('气泡图')
plt.subplot2grid((2, 3), (0, 2))
plt.scatter(x, y)
plt.title('散点图')
plt.subplot2grid((2, 3), (1, 0), colspan=3)
x = np.linspace(0, 10, 100)
y = np.sin(x)
plt.plot(x, y, c='c')
plt.title('曲线')
Text(0.5, 1.0, '曲线')
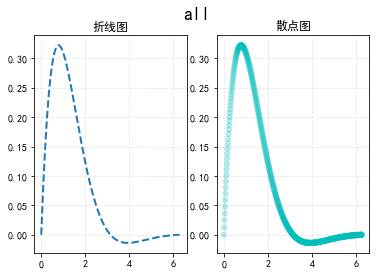
font_style = dict(fontsize=18, weight='black')
x = np.linspace(0, 2*np.pi, 500)
y = np.sin(x) *np.exp(-x)

fig, axes = plt.subplots(1, 2)

ax1 = axes[0]
ax1.plot(x,y,ls='--', lw=2)
ax1.set_title('折线图')
ax1.grid(ls=':', lw=1, alpha=0.3, c='gray')

ax2 = axes[1]
ax2.scatter(x,y, ls='--', lw=0.2, c='c', alpha=0.3)
ax2.set_title('散点图')
ax2.grid(ls=':', lw=1, alpha=0.3, c='gray')

plt.suptitle('all', **font_style)
Text(0.5, 0.98, 'all')
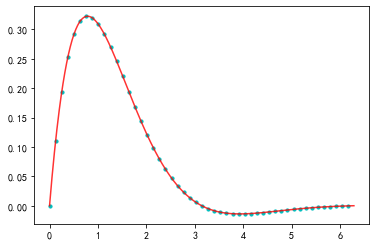
plt.clf()
plt.plot(x,y, c='r', alpha=0.8)
plt.scatter(x[::10], y[::10], s=10,c='c')
<matplotlib.collections.PathCollection at 0x1ffa6b59160>
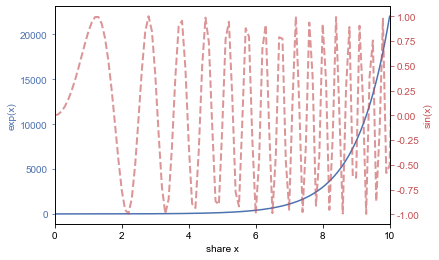
fig, ax1 = plt.subplots()
x = np.linspace(0.0, 10, 1000)

ax1.plot(x, np.exp(x), c='b')
ax1.tick_params('y', colors='b')
ax1.set_ylabel('exp(x)', c='b')
ax1.set_xlabel('share x')

t= np.arange(0, 11, 0.1)
ax2 = ax1.twinx()
ax2.plot(t, np.sin(t**2), ls='--', alpha=0.6, lw=2, c='r')
ax2.set_xlim(0, 10)
ax2.set_xlabel('share')
ax2.set_ylabel('sin(x)', c='r')
ax2.tick_params('y', colors='r')

sns.set()
sns.set_style('dark')
sns.set_theme(style='darkgrid')
x = np.linspace(1, 10, 500)
y = np.sin(x)
plt.plot(x, y, lw=2, ls='-', c='c')
[<matplotlib.lines.Line2D at 0x1ffa714ddc0>]