中文
mpl.rcParams['font.sans-serif'] = ['SimHei']
mpl.rcParams['axes.unicode_minus'] = False
设置seaborn风格
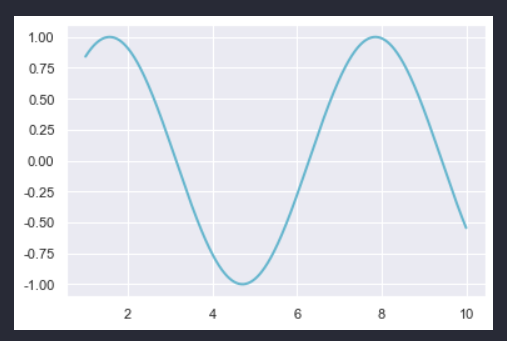
sns.set_theme(style='darkgrid')
x = np.linspace(1, 10, 500)
y = np.sin(x)
plt.plot(x, y, lw=2, ls='-', c='c')
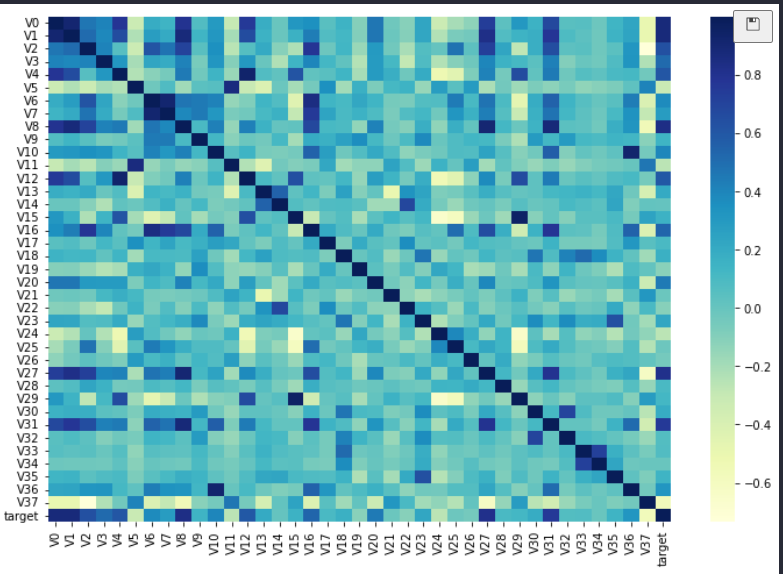
绘制热力图
df = pd.read_csv('zhengqi_train.txt', sep='\t', encoding='utf-8')
cor = df.corr()
fig, ax = plt.subplots(figsize=(12, 8))
sns.heatmap(cor, cmap='YlGnBu')
绘制箱线图
df.iplot(kind='box', boxpoints='outliers')
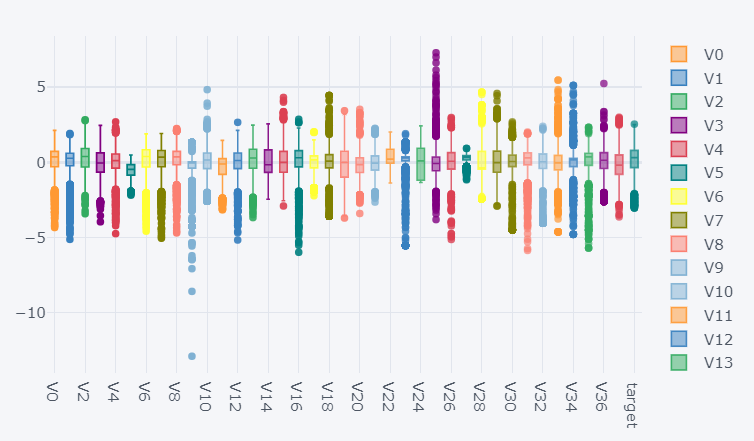
点的大小和透明度还没搞懂,后续再研究吧。