matplotlib 是python最著名的绘图库,它提供了一整套和matlab相似的命令API,十分适合交互式地进行制图。而且也可以方便地将它作为绘图控件,嵌入GUI应用程序中。它的文档相当完备,并且 Gallery页面 中有上百幅缩略图,打开之后都有源程序。因此如果你需要绘制某种类型的图,只需要在这个页面中浏览、复制、粘贴一下,基本上都能搞定。
安装
参考 http://blog.csdn.net/daniel_ustc/article/details/9714163
官网
http://matplotlib.org/1.2.1/index.html
注意其中的examples
案例
1. 柱状图
参考http://www.cnblogs.com/qianlifeng/archive/2012/02/13/2350086.html
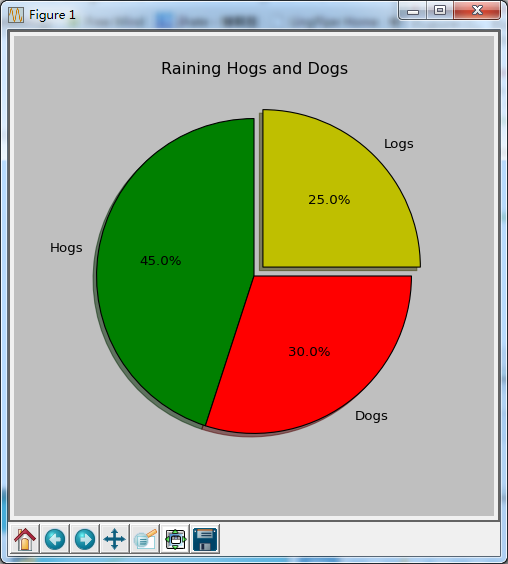
2. 饼形图
#! coding: cp936
from pylab import *

# make a square figure and axes
figure(1, figsize=(6,6))
ax = axes([0.1, 0.1, 0.8, 0.8])

fracs = [45, 30, 25]             #每一块占得比例,总和为100
explode=(0, 0, 0.08)             #离开整体的距离,看效果
labels = 'Hogs', 'Dogs', 'Logs'  #对应每一块的标志

pie(fracs, explode=explode, labels=labels,
                autopct='%1.1f%%', shadow=True, startangle=90, colors = ("g", "r", "y"))
                                 # startangle是开始的角度,默认为0,从这里开始按逆时针方向依次展开

title('Raining Hogs and Dogs')   #标题

show()
效果