一、前言:
白色系统:指一个系统的的内部特征是完全可以认知的,即系统的信息完全公开。
黑色系统:指一个系统的内部信息对外界来说是一无所知的,只能通过它与外界的联系来加以观测研究。
灰色系统:一部分的信息是已知的,另一部分是未知的,系统内各因素间有不确定的关系
GM11就是灰色系统,对单调性曲线有较好的预测。
二、python使用GM11
参考:https://github.com/judesmorning/python-GreyTheory
1、首先下载对应的模块
pip3 install greytheory
2、代码
from greytheory import GreyTheory
import matplotlib.pyplot as plt
import numpy as np

def predict(data_list):
    grey = GreyTheory()
    gm11 = grey.gm11 # GM11
    # To try customized alpha for IAGO of Z.
    gm11.alpha = 0.5
    gm11.convolution = True  # Convolutional forecasting of GM11. 卷积
    gm11.stride = 1 # 采样个数,1代表每个数都参与预测
    gm11.length = 4 # 卷积几个数
    for num in data_list:
        gm11.add_pattern(num, num) #第一个参数是参数历史取值,第二个是每个参数的标签,没有啥用
    gm11.forecast()
    for forecast in gm11.analyzed_results: #从预测结果里判断,如果不等于_TAG_FORECAST_HISTORY则代表是预测值,因为只预测一个,所以预测结果列表里只有一个是预测值,其他可能是卷积值和历史值对应的预测值
        if forecast.tag != gm11._TAG_FORECAST_HISTORY:
            res = forecast.forecast_value
    print("result:", res)

    X1=np.linspace(0,len(gm11.patterns),len(gm11.patterns),endpoint=True)
    plt.plot(X1,gm11.patterns)

    predict_list = []
    for num in gm11.analyzed_results:
        predict_list.append(num.forecast_value)
    # print("predict_list:",predict_list)
    X2=np.linspace(0,len(predict_list),len(predict_list),endpoint=True)
    plt.plot(X2,predict_list)
    plt.show()


if __name__=="__main__":
    # 1949~2018人口,预测2019年人口
    a="54167, 55196, 56300, 61465, 66207, 72538, 82992, 85229, 87177, 89211, 90859, 92420, 93717, 94974, 96259, 97542, 98705, 100072, 101654, 103008, 104357, 105851, 107507, 109300, 111026, 112704, 114333, 115823, 117171,118517, 119850, 121121, 122389, 123626, 124761, 125786, 126743, 127627, 128453, 129227, 129988, 130756, 131448, 132129, 132802, 133450, 134091, 134735, 135404, 136072, 136782, 137462, 138271, 139008, 139538"
    list = [float(i) for i in a.split(",")]  # 按照逗号分隔开并转为float
    predict(list)
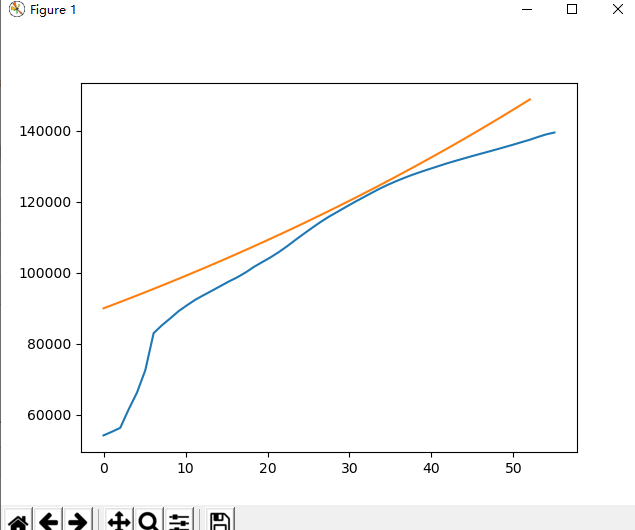
蓝色线是真实值,橙色线是预测值