测试要求:
在本次测试中,我需要并发50个User,每一个User占用一个独立的IP,并且只执行一次脚本。脚本中发起两个请求,其中第一次请求返回200后才执行第二个请求。使用win7 OS。
前置及Generator设置:
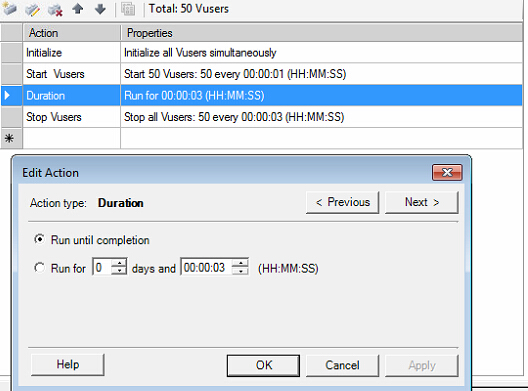
我的Run-time Settings这样设定:
Run Logic: Number of Iterations: 1 (保证只执行一次脚本)
Log: Enable Log. Always send messages.(不是只在出错时发送log。我需要通过log来验证我的测试要求是否达到)
Think Time: Ignore think time (我不要思考时间,我想第二个请求紧跟第一个请求后执行)
其他不变。
为了在同一台机器上跑50个IP,我使用IP Spoofing
在开始菜单,找到Loadruner所在文件夹,进去找到Tools,里面有一个IP Wizard(IP欺骗)
在创建新的IP之前,可以CMD查看ipconfig, 查看自己所在IP区间。使用IP欺骗时,需要使用空闲IP,为确保不影响公司网络,建议使用一个路由器搭建独立的IP区间。
我使用的IP区间为:
LAN Subnet : 192.168.32.0 / 23 (空闲IP区段:192.168.32.4 ~ 192.168.33.254)
Gateway : 192.168.32.1
到增加IP地址对话框时,注意配置是否正确。我的配置如下图。

完成之后可以将刚才的IP地址保存为“IP Address File(*.ips)”文件。(这一操作我没有做,还好Loadrunner已经非常智能,在Load Generators只增加localhost就可以搞定)
好了,在CMD查看ipconfig /all 是不是多了50个IP。
注意,IP Wizard不支持DHCP,需要本机配置为固定IP地址。
接下来写脚本。
我的脚本如下:
 1 Action()
 2 {
 3
 4     int status;
 5     int HttpRetCode;
 6     char *ip;
 7     ip = lr_get_vuser_ip();
 8 //检查Loadrunner Controller有没有Enable IP Spoofing
 9     if(ip)
10         lr_output_message("The IP address is %s", ip);
11     else
12         lr_output_message("IP spoofing disabled");
13 //设置集合点,让50个vuser一起发起第一个请求
14     lr_rendezvous("letusgo");
15 //开始第一个事务(请求)
16     lr_start_transaction("1stReq");
17
18     web_url("RCS_Initial_HTTP_Req",
19 //这里有一个参数化,我要每一次传递给该参数一个唯一的msisdn号码,并且只执行一次。
20 //我在参数属性对话框里设置:Select next row -> Unique
21 //                                          Update value on -> Once

22         "URL= http://xxx.yyy.com/self?x-forwarding-msisdn={NewParam}",
23         "TargetFrame=Main",
24         "Resource=0",
25         "RecContentType=text/html",
26         "Mode=http",
27         LAST );
28 //打印第一个请求的返回码
29     HttpRetCode = web_get_int_property(HTTP_INFO_RETURN_CODE);
30     lr_output_message("Response code:%d",HttpRetCode);
31 //检查返回码是否是200
32       if(HttpRetCode == 200){
33         lr_end_transaction("1stReq", LR_PASS);
34         sleep(2000);
35 //开始第二个事务(请求)
36         lr_start_transaction("2ndReq");
37         web_url("RCS_Initial_HTTP_Req",
38         "URL= https://xxx.yyy.com/self?vers=1&IMSI=1&rcs_version=1&rcs_profile=1&client_vendor=1&client_version=1&terminal_vendor=1&terminal_model=1&terminal_sw_version=1&IMEI=1&mock_scheme=HTTPS",
39         "TargetFrame=Main",
40         "Resource=0",
41         "RecContentType=text/html",
42         "Mode=http",
43         LAST );
44 //打印第二个请求的返回码
45          HttpRetCode = web_get_int_property(HTTP_INFO_RETURN_CODE);
46          lr_output_message("Response code:%d",HttpRetCode);
47 //检查返回码是否是200
48 //结束第二个事务(请求)
49         if(HttpRetCode == 200){
50             lr_end_transaction("2ndReq", LR_PASS);
51          }else{
52              lr_end_transaction("2ndReq", LR_FAIL);
53         }
54
55      return 0;  }else{
56 //结束第一个事务(请求)
57      lr_end_transaction("1stReq", LR_FAIL);
58      return 0;
59      }
60 }
61
场景设置:
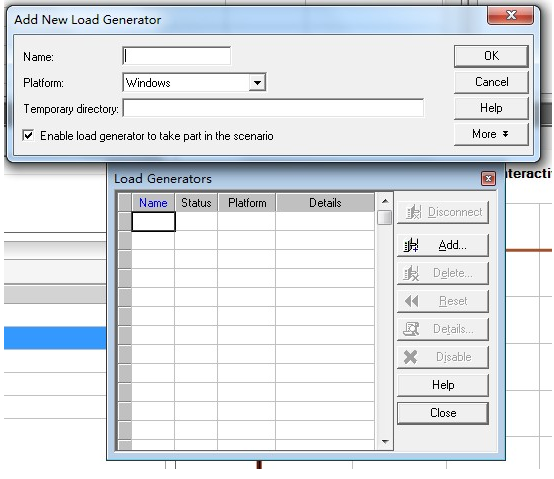
添加Load Generator
Name: localhost
Platform: windows
添加这一条就可以了。
然后将状态开启为Ready
一定要注意每一个Vuser的IP是否是唯一的。双击下图Scenario Groups里面的Group Name行可以打开每一个Vuser对应的Generator,查看其IP。

要监控一些服务器资源的资源如cpu,memory,disk,需要在controller里加入增加监控Unix Resources, 加入服务器地址。可以一次添加多个服务器。
前提:
需要关闭防火墙
需要在要监控的服务器上安装rstatd组件
[root@ ~]# service rstatd
Usage: /etc/init.d/rstatd {start|stop|status|restart|reload|force-reload}
[root@~]# service rstatd status
rpc.rstatd (pid 2650) is running...
[root@~]#
[root@~]# service rstatd status
rpc.rstatd (pid 2650) is running...
[root@~]#
可能报的错:
lr UNIX Resources. Cannot initialize the monitoring -47190
无法连接该服务器,请找公司OPS部门解决。我在测试中需要连接公司VPN服务器,在没有连接之前就会报这个错。
开始Run之前,别忘了log保存位置放到指定位置。在Results下面设置。
关于Result :
Graphs 右键 Add new items -> Add New Graph增加想要的图表结果
Reports -> HTML Report.. 生成html报告
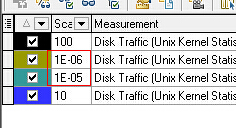
小心Scale陷阱
要乘以前面的Scale值,才是真实结果。
结果分析参考:
| UNIX counter | Windows Counter | Description |
| Average Load* | N/A | The sum of the number of processes waiting in the run queue plus the number currently executing. |
| Collision rate | N/A | The total number of network collisions/sec |
| Context switch rate | System – Context Switches/sec | The rate at which processors switch from executing one thread to another. High switch rates can indicate performance problems as servers juggle multiple running applications. |
| CPU utilisation | %Processor Time | The percentage of elapsed time that the process spends executing non-idle threads. |
| Disk traffic | %Disk time | The percentage of elapsed time that the disk(s) are busy servicing read or write requests. |
| Incoming packets error rate | Packets received errors | The number of packets received containing errors that precvent them from being delivered to a higher OSI layer protocol. |
| Incoming packets rate | Packets received/sec | The number of packets received on the network interface |
| Interrupt rate | Interrupts/sec | Average rate at which the processor receives and services hardware interrupts. Processes generate an interrupt when they finish a task and need to report that fact to the CPU. |
| Outgoing packets error rate | Packets outbound errors | The number of packets that can’t be transmitted due to errors |
| Outgoing packets rate | Packets sent / sec | The rate at which packets are sent on the network interface |
| Page-in rate | Pages Input/sec | The rate at which pages are read from disk to resolve hard page faults. Hard page faults occur when a process refers to a page in virtual memory which is not in it’s working set or available elsewhere in physical memory and has to be read from disk. |
| Page-out rate | Pages Output/sec | The rate at which memory pages are written to disk to free up space in physical memory. |
| Paging rate | Paging rate | The rate at which pages are read from disk or written to disk. This is the sum of Pages Input/sec and Pages Output/sec. |
| Swap-in rate | N/A | The number of pages read into memory per second |
| Swap-out rate | N/A | The number of pages written out of memory per second |
| System mode CPU utilization | Processor – %Priviledged time | The percentage of elapsed time that the processor spends executing user threads (i.e. running applications) |
| User mode CPU utilization | Processor – %User time | The percentage or elapsed time that the processor spends executing priviledged or system mode threads. |