echarts绘制省或市级地图

很多项目的可视化用到了echarts的地图,记录一下

  • 绘制地图之前需要确认自己的地图要分几层,分别实现什么功能
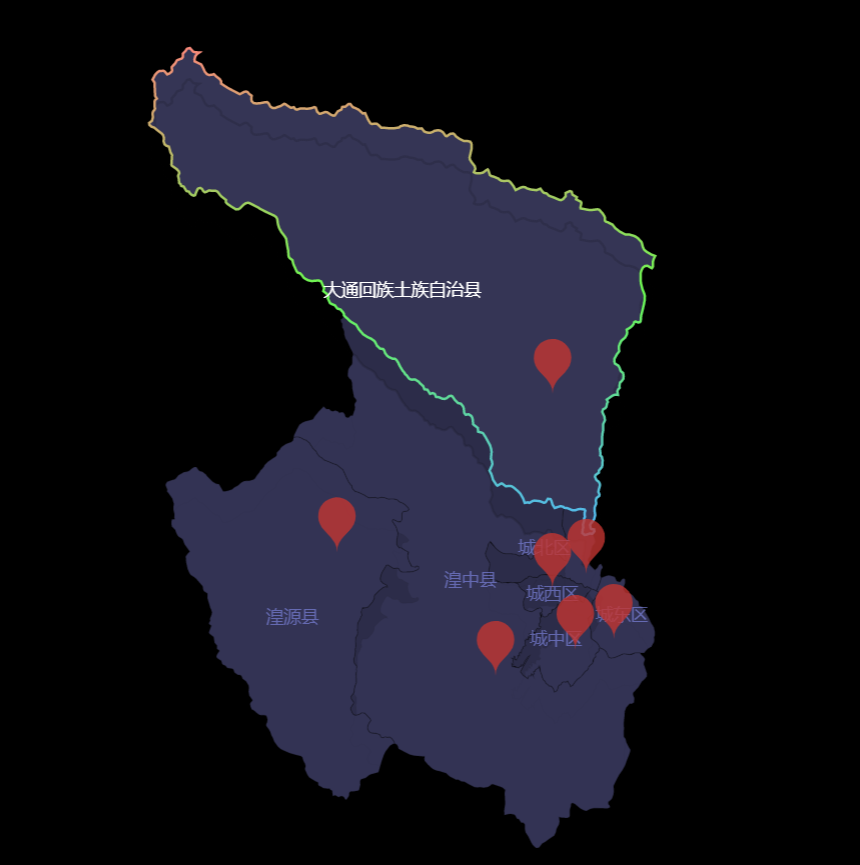
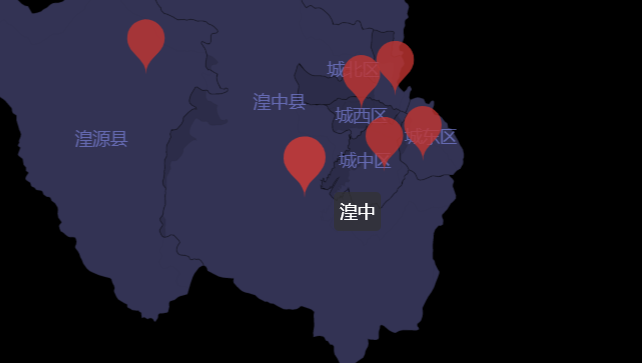
  • 本次实现的是两层地图效果,一层展示基础地图,一层在地图上添加标记点
  • 可拖动,可缩放

实现步骤

  1. 安装echarts到项目
  2. datav选择对应的省数据,左下角geojson下载,本次选择西宁市
  3. 创建第二层标记数据文件data-level.json
  4. 绘制地图

创建文件data-level.json方便之后引用

本文件name表示标记点提示文字,local表示经纬度在地图上进行标记

[
  {
    "name": "大通",
    "local": [101.702628,36.935435]
  },
  {
    "name": "湟中",
    "local": [101.584976,36.498543]
  },
  {
    "name": "湟源",
    "local": [101.257563,36.689975]
  },
  {
    "name": "城北",
    "local": [101.772122,36.656525]
  },
  {
    "name": "城西",
    "local": [101.70249,36.634612]
  },
  {
    "name": "城中",
    "local": [101.749737,36.538819]
  },
  {
    "name": "城东",
    "local": [101.829284,36.555646]
  }
]

写代码之前在main.js中添加

import echarts from 'echarts'
Vue.prototype.$echarts = echarts

HTML

<div id="map_chart" style=" 100%;height: 800px;background: #000;"></div>

javascript

        // 绘制地图
        mounted() {
            this.drawMapLine()
        },
        methods:{
            drawMapLine(){
                let geoCoordMap = require('./../assets/data-level.json')

                const convertData = function (data) {
                    const res = []
                    if (data[0]) {
                        for (let i = 0; i < data.length; i++) {
                            let geoCoord = data[i].name
                            if (geoCoord) {
                                res.push({
                                    name: data[i].name,
                                    value: data[i].local.concat(data[i].code)
                                })
                            }
                        }
                    }
                    return res
                }
                let echarts = require('echarts/lib/echarts')
                //  地图开始
                let Chart3 = echarts.init(document.getElementById('map_chart'))
                const mapData = require('./../assets/xining.json')
                const name = '西宁'
                this.$echarts.registerMap(name, mapData)
                Chart3.setOption({
                    geo: {
                        zoom: 1.1,
                        map: name,
                        aspectScale: 0.75,
                        roam: true,
                        label: {
                            show: true,
                            color: 'rgba(138,146,246,0.58)',
                            fontSize: 14
                        },
                        scaleLimit: {
                            min: 1,
                            max: 8
                        },
                        emphasis: {
                            label: {
                                color: '#fff',
                                show: true
                            }
                        },
                        itemStyle: {
                            normal: {
                                borderColor: 'rgba(0,0,0,0.18)',
                                borderWidth: 1,
                                areaColor: '#333354',
                                shadowColor: 'rgba(0,0,0,0.13)',
                                shadowOffsetX: 0,
                                shadowOffsetY: 25,
                                label: {
                                    show: true,
                                    fontWeight: 'bold',
                                    opacity: 0.54,
                                    color: 'rgba(138,146,246,0.58)',
                                    letterSpacing: '12.3px',
                                    textAlign: 'right'
                                }
                            },
                            emphasis: {
                                areaColor: '#353555',
                                borderColor: new echarts.graphic.LinearGradient(0, 0, 0, 1,
                                    [
                                        { offset: 0, color: '#f78879' },
                                        { offset: 0.5, color: '#6af651' },
                                        { offset: 1, color: '#51b3f6' }
                                    ]),
                                borderWidth: 2,
                                label: {
                                    color: '#fff',
                                    show: false
                                }
                            }
                        }
                    },
                    tooltip: {
                        formatter: function (e) {
                            // return e.data.displayname;
                            return e.name
                        }
                    },
                    series: [
                        {
                            type: 'scatter',
                            showEffectOn: 'render',
                            zoom: 1.1,
                            symbol: 'pin',
                            coordinateSystem: 'geo',
                            data: convertData(geoCoordMap),
                            symbolSize: 50,
                            hoverAnimation: true,
                            rippleEffect: {
                                period: 15,
                                scale: 4,
                                brushType: 'fill'
                            }
                        }
                    ]
                })
            }
        }

实现效果


原文地址:https://www.cnblogs.com/johu/p/13706383.html