进程使用的总的内存 M
ps aux | awk '{sum+=$6} END {print sum / 1024}'
进程使用的内存的详情
ps aux --sort -rss
free shows more memory used than top process total
See also http://www.linuxatemyram.com/ for a more in-depth explanation
Free vs Top vs /proc/meminfo
Process memory.
Adding up the memory used by processes in top and trying to match this with the used memory of free is going to give you a bad time. Due to top paging, you may not even get all the processes in this list a better way to go is to use ps aux --sort -rss to order processes by memory use.
Disk caching.
Linux is going to use the memory you aren't using to make things run much faster for you behind the scenes. This is noted in free's "cached" column and is why you should look at the values next to "-/+ buffers/cache" for actual used and free memory.
Kernel Slab cache.
Kernel modules and drivers have a way to use your unused memory too. The "SReclaimable" is memory that you could use under memory pressure. There's a cool tool called slabtop that can identify how the kernel is this cache.
Clearing caches.
echo 1 > /proc/sys/vm/drop_caches To free pagecache
echo 2 > /proc/sys/vm/drop_caches To free dentries and inodes
echo 3 > /proc/sys/vm/drop_caches To free pagecache, dentries and inodes
See also
- Meaning of the buffers/cache line in the output of free
- Explanation on Resident Set Size/Virtual Size
- Slab Allocation
解决SLES VM内存问题
本文档介绍如何快速解决SLES虚拟机的内存问题,以便解决问题并避免出现更大问题。
当我们使用大量VM时,很难监控它们在ESX级别的运行状况。如果幸运的话,我们可以访问vSphere以查看状态。是的我知道:在大型实施中,每个供应商都对其产品负责,在本例中为VMWare。
但重要的是我们对VM的健康状况有一定的了解(注意我说VM不是SO)。有很多事情可能会导致问题。这次我们将讨论:内存问题。
VMWare有一个名为Memory Balloon的工具(?),它基本上有助于在ESX接近物理内存不足时对其进行保护。“ 气球 ”膨胀以避免VM使用更多RAM,这使ESX保持安全。
http://www.vmware.com/files/pdf/perf-vsphere-memory_management.pdf
在我们没有管理员权限的常见情况下,我们可以在性能图表中查看vSphere中的气球行为,但除非您经常查看那些在气球内存被激活时无法实时了解的统计数据。
然后,我们如何知道内存气球何时被激活?我做了一个小故障排除工具来帮助找到答案。
- 什么用于VMware?
# lsof | grep vmware
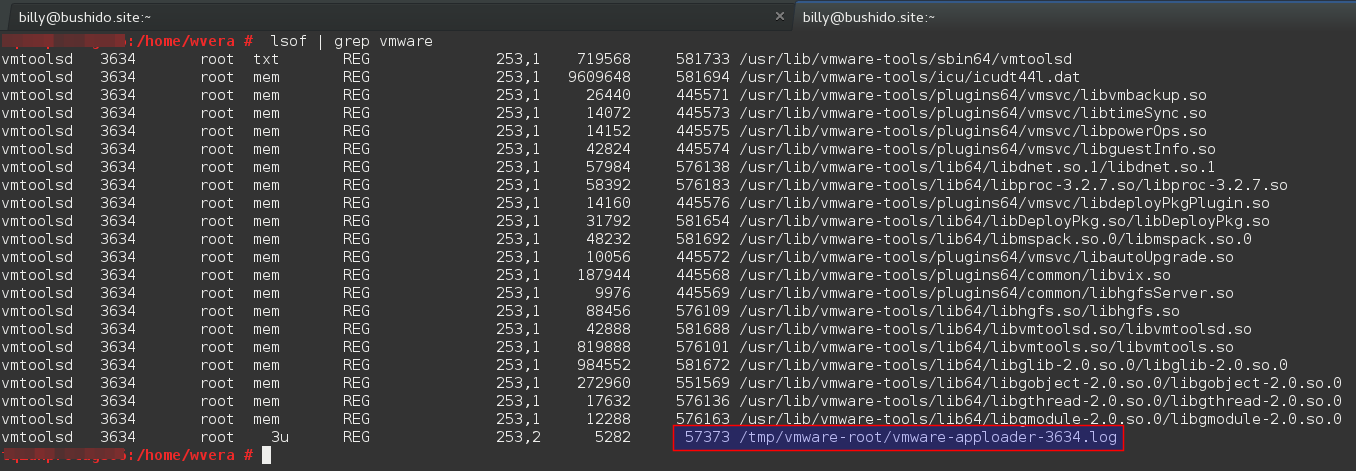
- 一个日志文件?甜!
# cd /tmp/vmware-root; head $(ls -tr | tail -1)
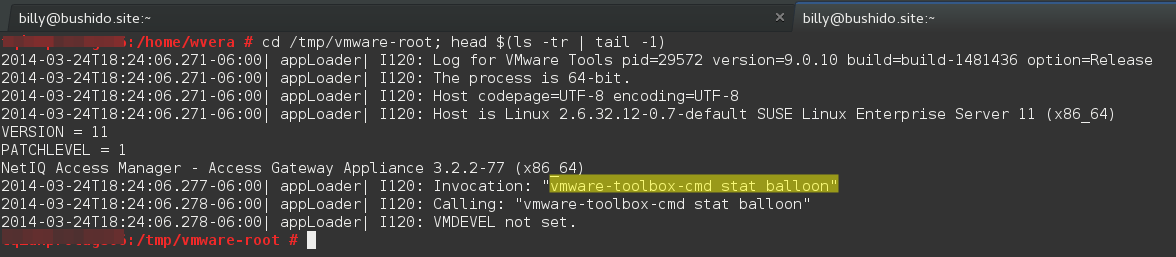
- 太简单?这真的有可能吗?咱们试试吧!
# vmware-toolbox-cmd stat balloon
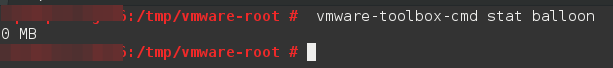
答对了!
由于Memory Balloon与代理(Linux中的vmmemctrl驱动程序)一起使用,我们可以确定:0 MB ==禁用,反之亦然。
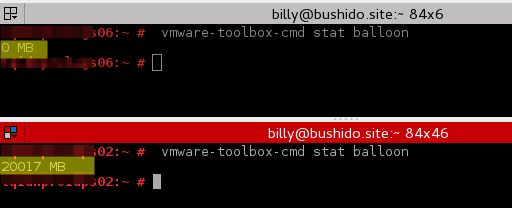
示例1:禁用内存气球。
示例2:内存气球激活并保留20017 MB的RAM!
检查: vmware-toolbox-cmd help stat 有关此工具的更多有用选项。
怎么办?为什么知道这个有用呢?
因为如果我们在大型实现中使用VM,我们可能在同一个ESX中有很多“ 邻居 ”。由于有如此多的ESX管理员试图以最佳方式管理其资源,因此他们不会“打开”分配给VM的所有资源。
例如,我有一个我们认为有32GB RAM的VM。在SO中,如果我们检查:
/proc/meminfo
free
top
......也许我们可以看到我们分配的记忆。但是,如果我们运行:
# vmware-toolbox-cmd stat memlimit
......而且存在差异,那么我们就有问题了。这可能意味着ESX管理员将我们的内存限制为低于我们分配的内存。
现在想象一下,如果我们知道我们“拥有”32GB的RAM分配给我们,并且我们正在运行Apache和Java服务,我们基于拥有32GB的RAM来调整它们......但实际上在ESX中我们限制为16GB(例如)而此时,我们的“ 邻居 ”正在使用大量内存和内存气球激活8GB内存!
然后我们谈论8GB的REAL内存,我们仍然认为它有32GB。
疯了吧?所以现在想象我们无法知道这一点(因为这发生在后端),你如何在SO级别对此进行故障排除?
这就是知道如何检查这些设置非常重要的原因。
结论:
在完美的世界里
vmware-toolbox-cmd stat memlimit
必须与SO存储器匹配。
vmware-toolbox-cmd stat balloon
必须为零。
通过密切关注这一点,我们可以避免许多麻烦。
所以,也许我们不仅可以避免ESX问题,但了解这一点,我们可以保持领先一步!
加上:使用vmware-toolbox-cmd我们也可以解决CPU问题。
https://www.suse.com/c/troubleshooting-sles-vm-memory-issues/