性能中的测试指标有很多,对于响应时间,除了查看90%、95%、99%的响应时间外,现在还有一个P99(可能比较小众,所以相关资料较少),表示过去 10 秒内最慢的 1% 请求的平均延迟。这个值的意义在于:如果这个值从测试开始到测试结束变化都不大的话,说明程序比较稳定,如果变化非常大,起起伏伏,说明程序里面有些地方在某种情况下有些逻辑没有处理好,导致问题,当然需要结合其他的内存,CPU,IOPS以及当前的请求数,响应数等等,这个在亚马逊云服务器也有说明。https://docs.aws.amazon.com/zh_cn/elasticbeanstalk/latest/dg/health-enhanced-metrics.html
那么怎么得到这个值呢?在使用jmeter性能测试中,发现插件和各种处理器都没有提供这个值的直接获取。那么我们就自己来编写脚本获取了,思路如下:①通过jmeter脚本导出每个请求的响应时间和结束时间;②通过Python脚本计算P99的值,并做出折线图。具体步骤如下:
一、通过jmeter脚本导出每个请求的响应时间和结束时间;
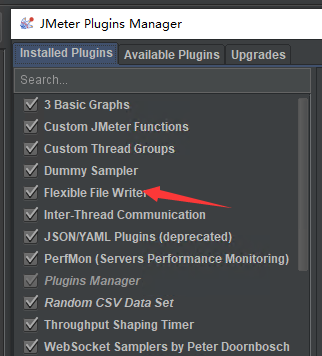
1、安装插件:Flexible File Writer
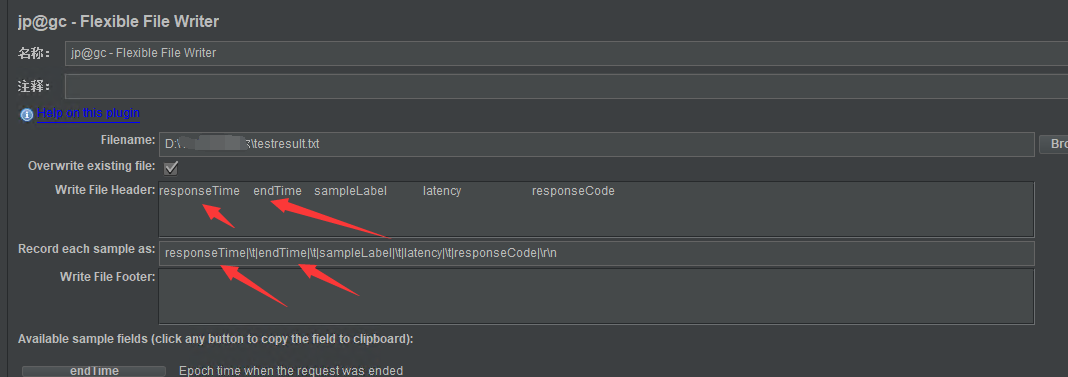
2、编辑Flexible File Writer,获取响应时间和结束时间等值,保存在txt文档里,用以后面处理
其中filename 是保存的文件路径;write file header 是保存文件中的第一行说明,用以标识每列的信息,值中间用空格隔开;record each sample as 记录的是每个样本对应的参数值,记录时,需要和下面的available sample fields保持一致(点击即可复制),值中间用| |隔开。
3、脚本运行后,就会记录对应的值在刚保存的txt文档里,例子如下:

Python读取第二行的内容是:b'426 1616068614679 2.get meetingroom inf 426 200 '
二、通过Python脚本计算P99的值,并做出折线图。
具体思路如下:
1、读取文本文件,获取第一列和第二列的值,并把这些值保存在列表里。第一列的值是响应时间,第二列的值是endtime;
2、定义一个函数,用于计算99%之外的响应时间的平均数;
3、使用循环语句,计算所有过去10秒内的响应时间的开始位置和结束位置,当总的结束时间不超过10S时,也需要考虑;然后每个位置调用步骤2中的函数,得到P99列表;
4、计算出需要绘图的X轴和Y轴列表。X轴用相对结束时间列表,Y轴用P99列表;使用matplotlib这个数学绘图库进行绘图。
5、完整代码如下:
# -*- coding: utf-8 -*-
import  logging
import matplotlib.pyplot as plt     #Python数据可视化最流行的工具之一是 matplotlib,它是一个数学绘图库
import numpy as np

logging.basicConfig(level=logging.DEBUG, filename='logger.log',format='%(asctime)s - %(name)s - %(levelname)s - %(message)s')  # 设置日志级别
file=r'F:/99.practice/paixu/testresult.txt'

other_ave=99

#获取文档中第一列:响应时间,输入到列表里
restimelist=[]          #响应时间列表
endtimelist=[]          #结束时间列表
otheravelist=[]         #其他外响应时间平均值列表
othertimelist=[]        #其他结束时间值列表
findstring='\'
with open(file,'rb+') as f:
    content=f.readlines()             #readlines返回文件中行内容列表
    lines=len(content)             #readlines返回文件中行内容列表,列表长度即为行数
    #print(lines)
    print(content[1])               #显示第2行内容,例如:b'426	1616068614679	2.get meetingroom inf	426	200
'
    for i in range(lines):
        if i>0:             #去除第一行表头
            digit=str(content[i]).find(findstring)        #查找每一行中findstring的第一个位置
            restime = int(str(content[i])[2:digit])     #每行内容转换为字符串,使用切片截取字符串
            endtime= int(str(content[i])[digit+2:digit+15])
            restimelist.append(restime)
            endtimelist.append(endtime)

logging.info('response time list is {}'.format(restimelist))
logging.info('end time list is {}'.format(endtimelist))
len_restime=len(restimelist)

def count_other_ave(start,end):          #定义函数,计算列表中other_ave之外的响应时间平均数
    restimelist_sort=sorted(restimelist[start:end])                 #排序响应时间
    restimelist_num = len(restimelist_sort)      #长度
    list_index = round(restimelist_num * other_ave / 100)  # 计算第other_ave%的位置,round四舍五入取整
    other_ave_result = round(sum(restimelist_sort[list_index:]) / (restimelist_num - list_index))  # 使用sum函数求和,除以剩余值的个数
    otheravelist.append(other_ave_result)               #插入other_ave之外的响应时间平均数
    return

for i  in range(len_restime):
    if (endtimelist[i]+10000)<endtimelist[-1]:    #结束时间+10000毫秒
        for j in range(i,len_restime):                        #从第i位开始,到最后
            if endtimelist[j]>=(endtimelist[i]+10000):              #从第i位开始,到最后,判断结束时间大于10S后的位置。
                startindex=i
                endindex=j
                if i%1000==0:                       #根据样本数,选择性来记录下endtime的开始和结束位置
                    logging.info('Endtime index begin at {},finish at {}'.format(startindex,endindex))
                count_other_ave(startindex,endindex)                #计算响应时间列表中other_ave之外的响应时间平均数
                othertimelist.append(endtimelist[j])
                break                              #计算一次,跳出循环
    else:
        count_other_ave(i,len_restime)
        othertimelist.append(endtimelist[j])
        break                             #当结束时间第一个和最后一个差距不超过10S,计算一次,跳出循环
logging.info('P{} list is {}'.format(other_ave,otheravelist))
print('The length of p{} list is {}'.format(other_ave,len(otheravelist)))
print('The p{} list is {}'.format(other_ave,otheravelist))

othertimelist_relative=(np.array(othertimelist)-othertimelist[0]).tolist()     #先把list变成array,进行减法或者加法操作,再把array变成list
logging.info('end time list relative is {}'.format(othertimelist_relative))

#绘图开始
plt.figure(figsize=(8,4))    #创建绘图对象,figsize参数可以指定绘图对象的宽度和高度,单位为英寸,一英寸=80px
plt.plot(othertimelist_relative,otheravelist,"b--",linewidth=1)   #在当前绘图对象中画图(x轴,y轴,蓝色虚线,画线宽度)
plt.xlabel("Time(ms)")       #X轴的文字
plt.ylabel("ave_res_time")      #Y轴标签
plt.title("P{} Line plot".format(other_ave))    #图标题
#plt.show()    #显示图
plt.savefig("F:/99.practice/paixu/line.png")   #保存图
绘图函数详细实例可以参考:https://www.jb51.net/article/130979.htm