【一】常用数据可视化图表库
1) echarts
a. https://echarts.baidu.com/
b. 百度开源, 如果要在 react 项目中使用, 需要下载 echarts-for-react
2) G2
a. https://antv.alipay.com/zh-cn/g2/3.x/index.html
b. 阿里开源
3) bizcharts
a. https://bizcharts.net/products/bizCharts
b. 基于 react 包装 G2 的开源库
c. 需要额外下载 @antv/data-set
4) d3
a. https://d3js.org.cn/
b. 国外的免费可视化图表库,使用较为繁琐,使用频率较低
【二】echarts柱状图
(1)首先将其基本案例写出,如下所示
/*** 柱状图---路由 */
import React, { Component, Fragment } from 'react'
import {
    Card,
    Button,
} from 'antd'
import ReactEcharts from 'echarts-for-react';

class Bar extends Component {
    state = {}
    /**返回柱状图配置对象 */
    getOption = () => {
        return {
            title: {/**标题组件,包含主标题和副标题 */
                text: '柱状图数据统计'
            },
            tooltip: {},/**提示框组件 */
            legend: {
                data: [{
                    name: '销量',
                    icon: 'circle',/**强制设置图形为圆*/
                    textStyle: {/** 设置文本为红色*/
                        color: 'red'
                    }
                },{
                    name: '库存',
                    icon: 'circle',/**强制设置图形为圆*/
                    textStyle: {/** 设置文本为红色*/
                        color: 'green'
                    }
                }]/**图例的数据数组 */
            },
            /**直角坐标系 grid 中的 x 轴 */
            xAxis: {
                data: ["衬衫", "羊毛衫", "雪纺衫", "裤子", "高跟鞋", "袜子"]
            },
            /**直角坐标系 grid 中的 y 轴 */
            yAxis: {},
            /**柱状/条形图 */
            series: [{
                name: '销量',
                type: 'bar',
                data: [5, 20, 36, 10, 10, 20]
            },{
                name: '库存',
                type: 'bar',
                data: [13, 8, 16, 18, 9, 16]
            }]
        }
    }
    render() {
        return (
            <Fragment>
                <Card>
                    <Button type="primary">更新</Button>
                </Card>
                <Card title="柱状图">
                    {/* render echarts option. */}
                    <ReactEcharts option={this.getOption()} />
                </Card>
            </Fragment>
        );
    }
}

export default Bar;
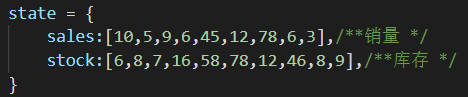
(2)接着讲数组数据改为state,然后传参到方法里进行实例化
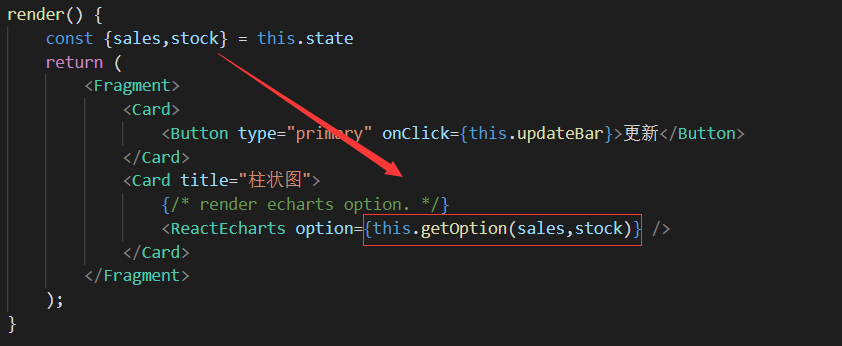
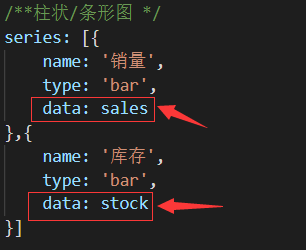
然后在返回配置对象里传入state
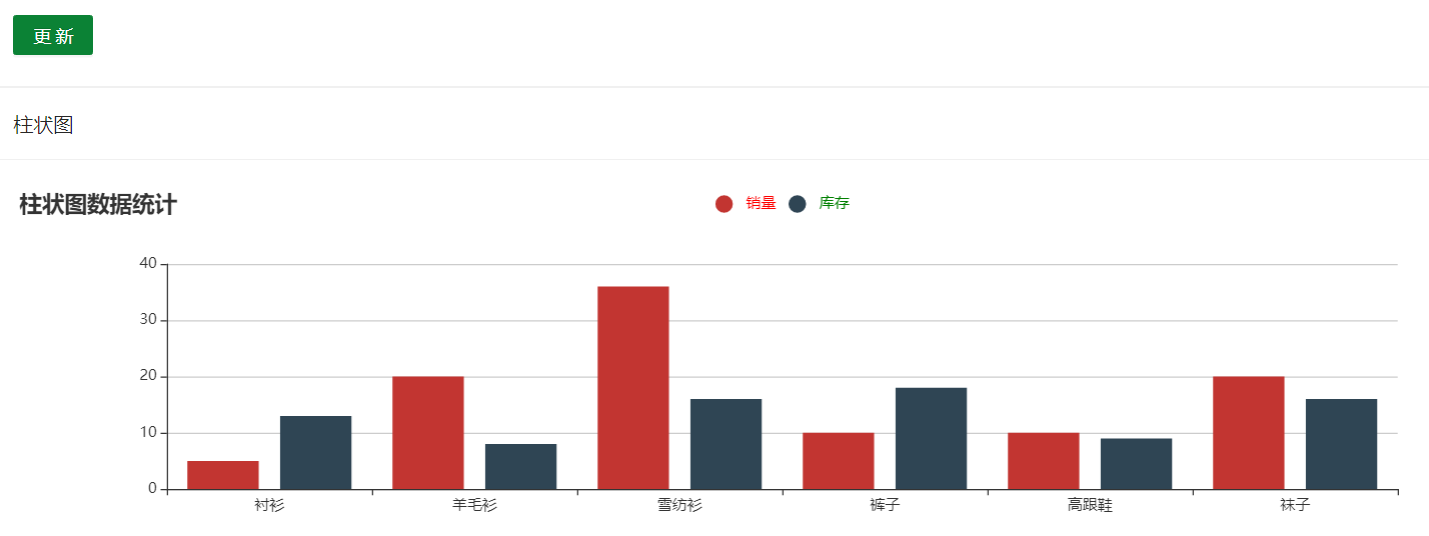
此时结果如下
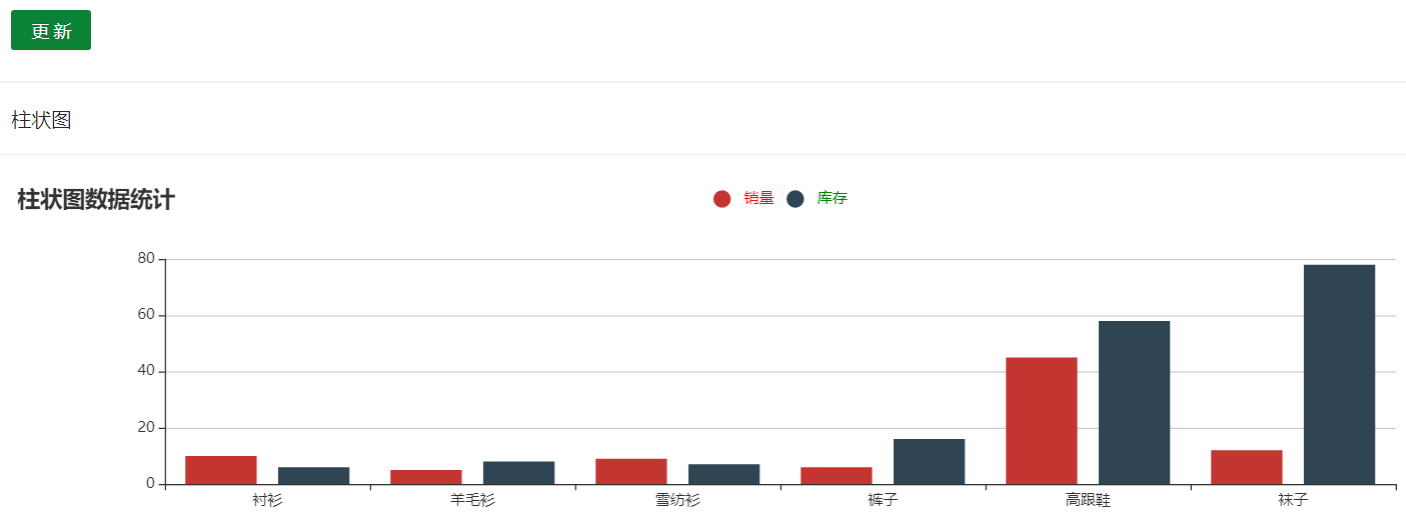
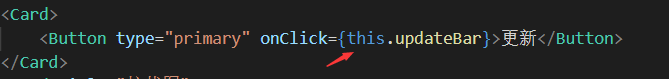
(3)点击按钮更新
点击按钮时,销量都+1,库存都-1,如下所示,分别用map和reduce
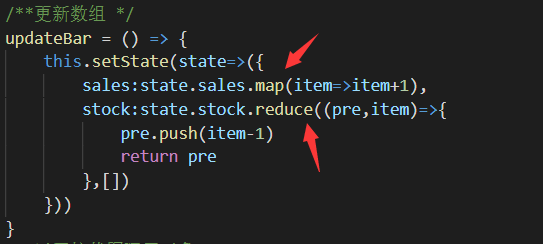
因为这里的state更新是基于原数组的变动,所以推荐使用函数式编程修改state。
【三】echarts折线图
如上所示,type改为line即可
.