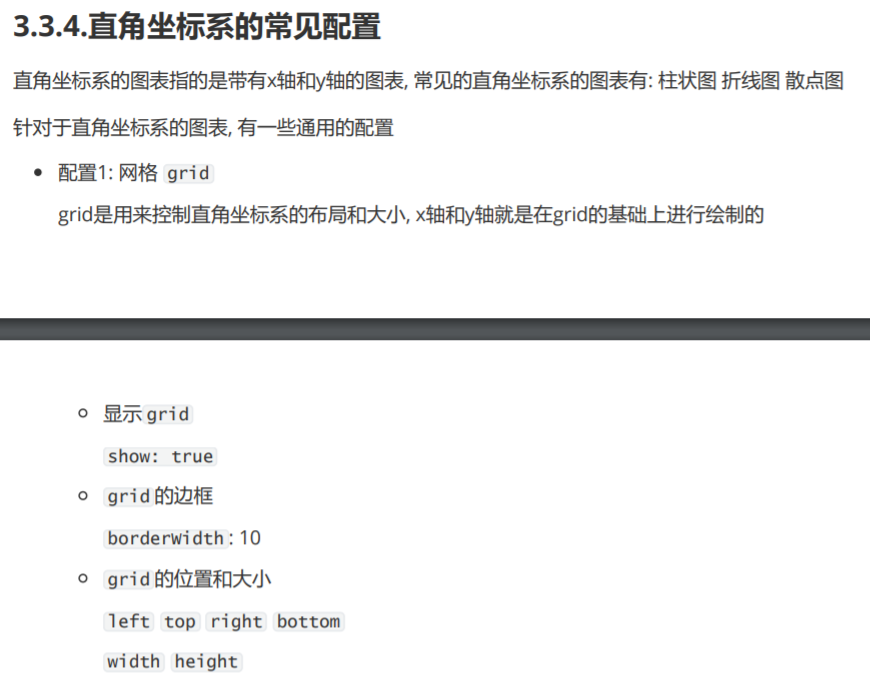
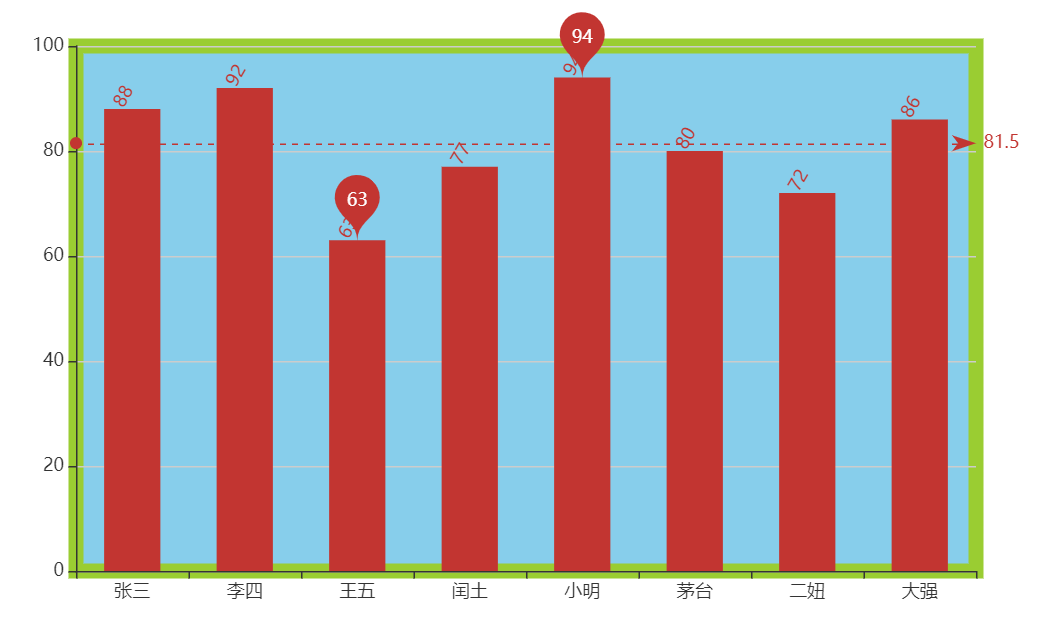
直角坐标系的常见配置

13.直角坐标系的常用配置_grid.html
<!DOCTYPE html>
<html lang="en">

<head>
  <meta charset="UTF-8">
  <meta name="viewport" content="width=device-width, initial-scale=1.0">
  <meta http-equiv="X-UA-Compatible" content="ie=edge">
  <title>Document</title>
  <script src="lib/echarts.min.js"></script>
</head>

<body>
  <div style=" 800px;height:600px"></div>
  <script>
    var mCharts = echarts.init(document.querySelector("div"))
    var xDataArr = ['张三', '李四', '王五', '闰土', '小明', '茅台', '二妞', '大强']
    var yDataArr = [88, 92, 63, 77, 94, 80, 72, 86]

    var option = {
      // 坐标轴容器
      grid: {
        show: true, // 是否可见
        borderWidth: 10, // 边框的宽度
        borderColor: 'yellowgreen', // 边框的颜色
        left: 60, // 边框的位置
        top: 30,
         600, // 边框的大小
        height: 350,
        backgroundColor: 'skyblue'
      },
      xAxis: {
        type: 'category',
        data: xDataArr
      },
      yAxis: {
        type: 'value'
      },
      series: [
        {
          name: '语文',
          type: 'bar',
          markPoint: {
            data: [
              {
                type: 'max', name: '最大值'
              }, {
                type: 'min', name: '最小值'
              }
            ]
          },
          markLine: {
            data: [
              {
                type: 'average', name: '平均值'
              }
            ]
          },
          label: {
            show: true,
            rotate: 60,
            position: 'top',
            // color: '#fff'
          },
          barWidth: '50%',
          data: yDataArr
        }
      ]
    }
    mCharts.setOption(option)
  </script>
</body>

</html>
- 配置2: 坐标轴 axis

14.直角坐标系的常用配置_axis.html
<!DOCTYPE html>
<html lang="en">

<head>
  <meta charset="UTF-8">
  <meta name="viewport" content="width=device-width, initial-scale=1.0">
  <meta http-equiv="X-UA-Compatible" content="ie=edge">
  <title>Document</title>
  <script src="lib/echarts.min.js"></script>
</head>

<body>
  <div style=" 600px;height:400px"></div>
  <script>
    var mCharts = echarts.init(document.querySelector("div"))
    var xDataArr = ['张三', '李四', '王五', '闰土', '小明', '茅台', '二妞', '大强']
    var yDataArr = [88, 92, 63, 77, 94, 80, 72, 86]

    var option = {
      grid: {
        show: true,
        borderColor: '#399',
        borderWidth: 8
      },
      xAxis: {
        type: 'category',
        data: xDataArr,
        position: 'top' // 控制坐标轴的位置
      },
      yAxis: {
        type: 'value',
        position: 'right' // 控制坐标轴的位置
      },
      series: [
        {
          name: '语文',
          type: 'bar',
          markPoint: {
            data: [
              {
                type: 'max', name: '最大值'
              }, {
                type: 'min', name: '最小值'
              }
            ]
          },
          markLine: {
            data: [
              {
                type: 'average', name: '平均值'
              }
            ]
          },
          label: {
            show: true,
            rotate: 60,
            position: 'top'
          },
          barWidth: '30%',
          data: yDataArr
        }
      ]
    }
    mCharts.setOption(option)
  </script>
</body>

</html>

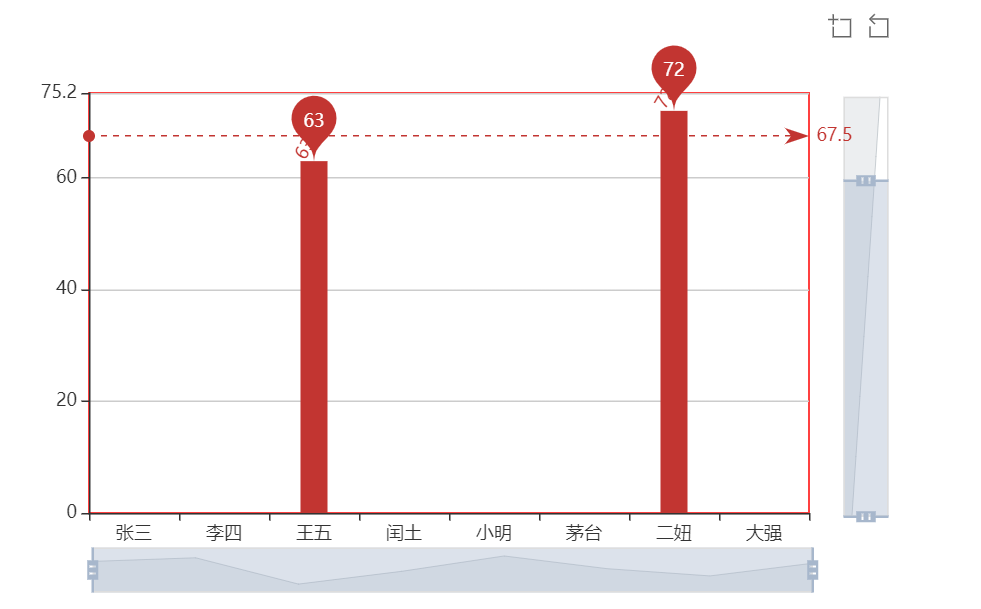
- 配置3: 区域缩放 dataZoom


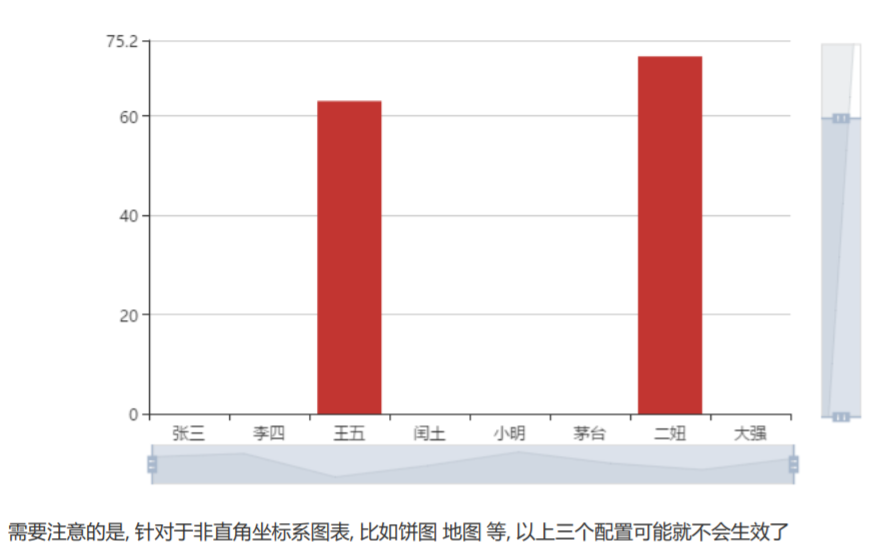
15.直角坐标系的常用配置dataZoom.html
<!DOCTYPE html>
<html lang="en">

<head>
  <meta charset="UTF-8">
  <meta name="viewport" content="width=device-width, initial-scale=1.0">
  <meta http-equiv="X-UA-Compatible" content="ie=edge">
  <title>Document</title>
  <script src="lib/echarts.min.js"></script>
</head>

<body>
  <div style=" 600px;height:400px"></div>
  <script>
    var mCharts = echarts.init(document.querySelector("div"))
    var xDataArr = ['张三', '李四', '王五', '闰土', '小明', '茅台', '二妞', '大强']
    var yDataArr = [88, 92, 63, 77, 94, 80, 72, 86]

    var option = {
      // 控制区域缩放效果的实现
      dataZoom: [
        {
          // 缩放的类型: slide代表滑块, inside代表依靠鼠标滚轮
          type: 'slider',
          // type: 'inside'
          xAxisIndex: 0
        },
        {
          type: 'slider',
          yAxisIndex: 0,
          start: 0, // 渲染完成后, 数据筛选的初始值, 百分比
          end: 80 // 渲染完成后, 数据筛选的结束值, 百分比
        }
      ],
      toolbox: {
        feature: {
          dataZoom: {}
        }
      },
      grid: {
        show: true,
        borderColor: 'red',
      },
      xAxis: {
        type: 'category',
        data: xDataArr
      },
      yAxis: {
        type: 'value'
      },
      series: [
        {
          name: '语文',
          type: 'bar',
          markPoint: {
            data: [
              {
                type: 'max', name: '最大值'
              }, {
                type: 'min', name: '最小值'
              }
            ]
          },
          markLine: {
            data: [
              {
                type: 'average', name: '平均值'
              }
            ]
          },
          label: {
            show: true,
            rotate: 60,
            position: 'top'
          },
          barWidth: '30%',
          data: yDataArr
        }
      ]
    }
    mCharts.setOption(option)
  </script>
</body>

</html>