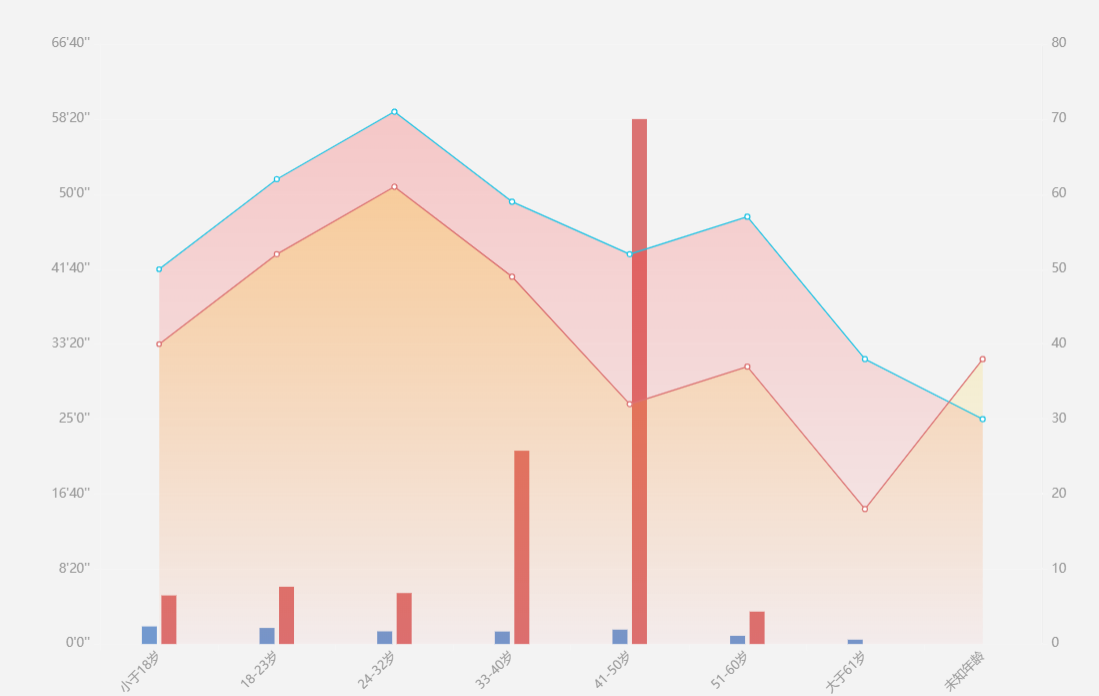
app.title = '折柱混合';

option = {
 grid: {
    left: '5%',   //距离左边的距离
    right: '5%', //距离右边的距离
    top:'8%',
    bottom:'5%',
    containLabel: true
    },
    tooltip: {
      trigger: 'axis',
      backgroundColor:'rgba(0,0,0,0.75)',
      axisPointer: {
        crossStyle: {
          color: '#999'
        },
        label: {
          backgroundColor: 'rgba(0,0,0,0.75)'
        }
      },

    },
    xAxis: [{
      type: 'category',
      data: ["小于18岁", "18-23岁", "24-32岁", "33-40岁", "41-50岁", "51-60岁", "大于61岁", "未知年龄"],
      axisPointer: {
        type: ''
      },
      axisLine: {
        lineStyle: {
          type: 'solid',
          color: '#f5f5f5',//左边线的颜色
          '1'//坐标线的宽度
        }
      },
      axisLabel: {
        interval:0,
        rotate:45,
        textStyle: {
          color:'#999',
          fontSize:'10'
        }
      },
    }],
    yAxis: [
      {
        type: 'value',
        name: '',
        splitNumber :8,
        axisPointer: {
          type: ''
        },
        axisLine: {
          lineStyle: {
            type: 'solid',
            color: '#f5f5f5',//左边线的颜色
            '1'//坐标线的宽度
          }
        },
        position:'left',
        splitLine: {
          show:false,
          lineStyle: {
            color: ['#f5f5f5']
          }
        },
        axisLabel: {
          textStyle: {
            color:'#999',
            fontSize:'10'
          },
          formatter: function (value) {
            // var hh = Math.floor(value % 3600 / 60 / 60)
            var mm = Math.floor(value % 3600 / 60);
            var ss = Math.floor(value % 60);
            if(value>3500){
              return mm + 60 + "'" + ss + "''";
            }else{
              return mm + "'" + ss + "''";
            }
          }
        }
      },
      {
        type: 'value',
        name: '',
        splitNumber :8,
        axisPointer: {
          type: ''
        },
        axisLine: {
          show:'false',
          lineStyle: {
            type: 'solid',
            color: '#f5f5f5',//左边线的颜色
            '1'//坐标线的宽度
          }
        },
        splitLine: {
          show:'false',
          lineStyle: {
            color: ['#f5f5f5']
          }
        },
        axisLabel: {
          textStyle: {
            color:'#999',
            fontSize:'10'
          },
        }
      }
    ],
    series: [
      {
        name:'男',
        type:'bar',
        data: [117.3005, 107.2594, 84.4112, 83.3266, 95.9611, 54.8313, 29.0411, 0],
        barWidth : 12,
        itemStyle: {
          normal: {
              color:'#7299CF'
          }
        }
      },
      {
        name:'女',
        type:'bar',
        data:[324.082, 382.1394, 340.01627, 1289.3278, 3501.2786, 216.18571, 0, 0],
        barWidth : 12,
        itemStyle: {
          normal: {
              color:'#DB7272'
          }
        }
      },
      {
        name:'男',
        type:'line',
        yAxisIndex: 2,
        symbol:'circle',
        yAxisIndex: 1,
        data:[50, 62, 71, 59, 52, 57, 38, 30],
        itemStyle: {
          normal: {
            color: "#fff",
            borderColor: '#1FC3E4',
            borderWidth: 1,
            lineStyle: {
              color:'#1FC3E4',
              1
            }
          },
          emphasis:{
            color:'#1FC3E4',
          }
        },
        areaStyle:{
          normal:{
            opacity:'0.3',
            //颜色渐变函数 前四个参数分别表示四个位置依次为左、下、右、上
              color: new echarts.graphic.LinearGradient(0, 0, 0, 1, [{
                offset: 0,
                color: 'rgba(255,0,0,0.6)'
              },{
                offset: 1,
                color: 'rgba(255,0,0,0.1)'
              }])
          }
        }
      },
      {
        name:'女',
        type:'line',
        yAxisIndex: 1,
        symbol:'circle',
        yAxisIndex: 1,
        data:[40, 52, 61, 49, 32, 37, 18,38],
        itemStyle: {
          normal: {
            color: "#fff",
            borderColor: "#DB7272",
            borderWidth: 1,
            lineStyle: {
              color:"#DB7272",
              1
            }
          },
          emphasis:{
            color:"#DB7272",
          }
        },
        areaStyle:{
          normal:{
            opacity:'0.3',
            //颜色渐变函数 前四个参数分别表示四个位置依次为左、下、右、上
              color: new echarts.graphic.LinearGradient(0, 0, 0, 1, [{
                offset: 0,
                color: 'rgba(255,203,0,0.8)'
              },{
                offset: 1,
                color: 'rgba(255,203,0,0)'
              }])
          }
        }
      }
    ]
}