效果: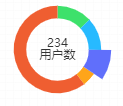
代码:
var myChart = echarts.init(document.getElementById('quanshi-echarts-two'));
    option = {
      grid:{ //设置图表撑满整个画布
        top:"12px",
        left:"12px",
        right:"16px",
        bottom:"12px",
        containLabel:true
      },
      series: [
        {
          name:'访问来源',
          type:'pie',
          radius: ['50%', '70%'],
          avoidLabelOverlap: false,
          label: {
              normal: {
                  show: false,
                  position: 'center',
                  formatter: function(data){ // 设置圆饼图中间文字排版
                    return data.value+"
"+"用户数"
                  }
              },
              emphasis: {
                  show: true, //文字至于中间时,这里需为true
                  textStyle: { //设置文字样式
                      fontSize: '12',
                      color:"#333"
                  }
              }
          },
          labelLine: {
              normal: {
                  show: false
              }
          },
          data:[
              {value:335, name:'优秀',itemStyle:{color:"#3de16b"}},
              {value:310, name:'良好',itemStyle:{color:"#27baff"}},
              {value:234, name:'一般',itemStyle:{color:"#5865e5"}},
              {value:135, name:'较差',itemStyle:{color:"#fea51a"}},
              {value:1548, name:'糟糕',itemStyle:{color:"#ef5e31"}}
          ]
        }
      ]
    };
    myChart.setOption(option);
    //设置默认选中高亮部分
    myChart.dispatchAction({type: 'highlight',seriesIndex: 0,dataIndex: 0});
// 当鼠标移入时,如果不是第一项,则把当前项置为选中,如果是第一项,则设置第一项为当前项
myChart.on('mouseover',function(e){
myChart.dispatchAction({type: 'downplay',seriesIndex: 0,dataIndex:0});
if(e.dataIndex != index){
myChart.dispatchAction({type: 'downplay', seriesIndex: 0, dataIndex: index });
}
if(e.dataIndex == 0){
myChart.dispatchAction({type: 'highlight',seriesIndex: 0,dataIndex:e.dataIndex});
}
});
    //当鼠标离开时,把当前项置为选中
    myChart.on('mouseout',function(e){
        index = e.dataIndex;
        myChart.dispatchAction({type: 'highlight',seriesIndex: 0,dataIndex: e.dataIndex});
    });