本文地址 http://www.cnblogs.com/jasonxuli/p/6397244.html
https://www.elastic.co 上,elasticsearch,logstash (filebeat),kibana 都有各自的教程,基本照做就可以跑通。
但只是初步跑起来,如果要都作为服务运行,需要使用 rpm 包安装。
系统:
# cat /etc/issue
CentOS release 6.5 (Final)
ElasticSearch
安装后会创建用户 elasticsearch。
修改配置文件:
> vim /etc/elasticsearch/elasticsearch.yml

# ---------------------------------- Network -----------------------------------
#
# Set the bind address to a specific IP (IPv4 or IPv6):
#
# network.host: 127.0.0.1
network.host: 192.168.20.50
#
# Set a custom port for HTTP:
#
http.port: 9200

...

bootstrap.system_call_filter: false
!使用本地 IP(127.0.0.1)时,Elasticsearch 进入 dev mode,只能从本机访问,只显示警告。
!使用局域网IP后,可以从其他机器访问,但启动时进入 production mode,并进行 bootstrap check,有可能对不合适的系统参数报错。
例如:
ERROR: bootstrap checks failed
max file descriptors [65535] for elasticsearch process likely too low, increase to at least [65536]
memory locking requested for elasticsearch process but memory is not locked
max number of threads [1024] for user [jason] likely too low, increase to at least [2048]
max virtual memory areas vm.max_map_count [65530] likely too low, increase to at least [262144]
system call filters failed to install; check the logs and fix your configuration or disable system call filters at your own risk
需要针对这些参数进行设置:
> vim /etc/security/limits.conf
...
elasticsearch hard nofile 65536  # 针对 max file descriptors
elasticsearch soft nproc 2048    # 针对 max number of threads

> vim /etc/sysctl.conf
...
vm.max_map_count=262144          # 针对 max virtual memory areas

> vim /etc/elasticsearch/elasticsearch.yml

...
bootstrap.system_call_filter: false   # 针对 system call filters failed to install, 参见 https://www.elastic.co/guide/en/elasticsearch/reference/current/system-call-filter-check.html
memory locking 的问题似乎改了上面几个就没有出现了。
sudo chkconfig --add elasticsearch   # configure Elasticsearch to start automatically when the system boots up
sudo -i service elasticsearch start
sudo -i service elasticsearch stop
日志: /var/log/elasticsearch/
LogStash
安装:
rpm -vi logstash-5.2.0.rpm
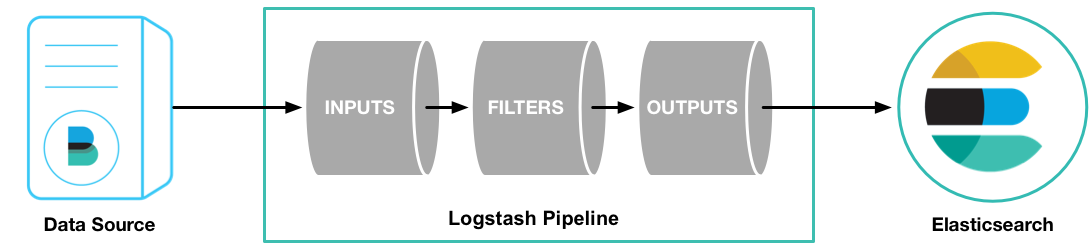
这个例子里使用 Filebeat 将测试用的 Apache web log 作为 logstash的输入,解析并写入数据到 ElasticSearch 中。
目前还不需要修改 logstash.yml,logstash 会读取 /etc/logstash/conf.d/ 目录下的文件作为 pipeline 配置文件。
新建 logstash pipeline 配置文件:
> vim /etc/logstash/conf.d/first-pipeline.conf

input {
    beats {
        port => "5043"
    }
}
filter {
    grok {
        match => { "message" => "%{COMBINEDAPACHELOG}"}
    }
    geoip {
        source => "clientip"
    }
}
output {
    elasticsearch {
        hosts => [ "192.168.20.50:9200" ]
        index => "testlog-%{+YYYY.MM.dd}"
    }
}
grok 可以解析未结构化的日志数据,Grok filter pattern 测试网站:http://grokdebug.herokuapp.com/上述日志匹配模式为:
%{COMBINEDAPACHELOG}
相当于:
%{IPORHOST:clientip} %{USER:ident} %{USER:auth}
[%{HTTPDATE:timestamp}] "(?:%{WORD:verb} %{NOTSPACE:request}
(?: HTTP/%{NUMBER:httpversion})?|%{DATA:rawrequest})" %{NUMBER:response}
(?:%{NUMBER:bytes}|-) %{QS:referrer} %{QS:agent}
启动:
sudo initctl start logstash // 作为服务运行,在使用Upstart的系统中
接下来需要安装 Filebeat 来作为 input 获取数据。
解压用 gzip -d logstash-tutorial.log.gz
Filebeat
The Beats are open source data shippers that you install as agents on your servers to send different types of operational data to Elasticsearch. Beats can send data directly to Elasticsearch or send it to Elasticsearch via Logstash, which you can use to parse and transform the data.
安装:
curl -L -O https://artifacts.elastic.co/downloads/beats/filebeat/filebeat-5.2.0-x86_64.rpm
sudo rpm -vi filebeat-5.2.0-x86_64.rpm
配置:
> vim /etc/filebeat/filebeat.yml

filebeat.prospectors:

- input_type: log
  paths:
    - /var/log/logstash-tutorial.log   # 之前下载的测试文件
    #- /var/log/*.log
    #- c:programdataelasticsearchlogs*

...

#----------------------------- Logstash output --------------------------------
output.logstash:
  # The Logstash hosts
  #hosts: ["localhost:5044"]
  hosts: ["localhost:5043"]
rpm 安装、启动
curl -L -O https://artifacts.elastic.co/downloads/beats/filebeat/filebeat-5.2.0-x86_64.rpm
sudo rpm -vi filebeat-5.2.0-x86_64.rpm
sudo /etc/init.d/filebeat start
kibana
kibana 5.2.0 要求 Elasticsearch 也为 5.2.0 。
修改配置:
> vim /etc/kibana/kibana.yml

server.host: "192.168.20.50"

elasticsearch.url: "http://192.168.20.50:9200"
> sudo chkconfig --add kibana   # 设置自动启动

> sudo -i service kibana start
> sudo -i service kibana stop
验证
1,检查 Elasticsearch 的索引:
http://192.168.20.50:9200/_cat/indices?v
2,根据之前 first-pipeline.conf 中的索引设置,创建出的索引应该是 testlog-2017.02.14,查询API为:
http://192.168.20.50:9200/testlog-2017.02.14/_search?
3,filebeat 第一次启动后应该会解析测试日志文件中的所有数据。
之后可以添加新日志进去,然后刷新 ES 索引的url,看到该索引的 count 增加就说明解析新日志成功了。这个延迟大概几秒钟。
echo '1.1.1.3 - - [04/Jan/2015:05:13:42 +0000] "GET /test.png HTTP/1.1" 200 203023 "http://test.com/" "Mozilla/5.0"' >> /var/log/logstash-tutorial.log