xdebug简介:
Xdebug是一个开放源代码的PHP程序调试器(即一个Debug工具),可以用来跟踪,调试和分析PHP程序的运行状况。它以php扩展的形式存在,在centos下可以通过yum install php70-php-pecl-xdebug安装(针对php70版本,其他类似。也可以以其他形式安装,是pecl库扩展)。
xdebug功能:
- basic functions:Xdebug's basic functions include the display of stack traces on error conditions, maximum nesting level protection and time tracking.(基础功能:在error conditions时显示stack traces、maximum nesting level protection、 time tracking)
- Variable Display Features:Xdebug replaces PHP's var_dump() function for displaying variables. Xdebug's version includes different colors for different types and places limits on the amount of array elements/object properties, maximum depth and string lengths. There are a few other functions dealing with variable display as well.
- Stack Traces: When Xdebug is activated it will show a stack trace whenever PHP decides to show a notice, warning, error etc. The information that stack traces display, and the way how they are presented, can be configured to suit your needs.
- Function Traces: Xdebug allows you to log all function calls, including parameters and return values to a file in different formats.
- Code Coverage Analysis: Code coverage tells you which lines of script (or set of scripts) have been executed during a request. With this information you can for example find out how good your unit tests are.
- Profiling PHP Scripts:Xdebug's built-in profiler allows you to find bottlenecks in your script and visualize those with an external tool such as KCacheGrind or WinCacheGrind.
- Remote Debugging:Xdebug provides an interface for debugger clients that interact with running PHP scripts. This section explains how to set-up PHP and Xdebug to allow this, and introduces a few clients.
xdebug配置:
在安装了xdebug扩展后,对xdebug功能的使用是在php.ini中xdebug对应的配置参数中进行控制的。通过yum安装的xdebug安装时会生成一个xdebug.ini,并存放在php.d目录中(不同方式安装放置的位置可能不同,不过最终都可以通过phpinfo()查看)。
在xdebug.ini中有关于各个配置项的详细说明。另外也可以参考官方文档:https://xdebug.org/docs/
我的配置:
1. remote debugging远程调试配置:
xdebug.remote_enable = 1
xdebug.remote_port = 9002
xdebug.remote_host = localhost
xdebug.idekey = phpstorm
2. profiling php scripts配置:
xdebug.profiler_enable = 0
xdebug.profiler_enable_trigger = 1
xdebug.profiler_output_name = cachegrind.out.%t.%p
xdebug.profiler_output_dir = "/dir/to/output/file"
a
xdebug部分参考文献:
1. 官方文档:https://xdebug.org/docs/
xdebug远程调试功能配置
远程调试通信建立方式:
With a static IP/single developer
With remote debugging, Xdebug embedded in PHP acts like the client, and the IDE as the server. The following animation shows how the communication channel is set-up:
- The IP of the server is 10.0.1.2 with HTTP on port 80
- The IDE is on IP 10.0.1.42, so xdebug.remote_host is set to 10.0.1.42
- The IDE listens on port 9000, so xdebug.remote_port is set to 9000
- The HTTP request is started on the machine running the IDE
- Xdebug connects to 10.0.1.42:9000
- Debugging runs, HTTP Response provided
With an unknown IP/multiple developers
If xdebug.remote_connect_back is used, the set-up is slightly different:

- The IP of the server is 10.0.1.2 with HTTP on port 80
- The IDE is on an unknown IP, so xdebug.remote_connect_back is set to 1
- The IDE listens on port 9000, so xdebug.remote_port is set to 9000
- The HTTP request is made, Xdebug detects the IP addres from the HTTP headers
- Xdebug connects to the detected IP (10.0.1.42) on port 9000
- Debugging runs, HTTP Response provided
xdebug部分配置
参考前面的提到的配置,以及上面针对不同通信建立方式配置不同的配置项目。
客户端配置
1. vim + dbgp配置
在vim下使用xdebug进行调试需要安装vim DGBP插件http://www.vim.org/scripts/script.php?script_id=1929
并且通过
let g:debuggerPort = 9002
设置客户端端口
之后按下F5即可进入debug监听模式,等待请求的到来。
2. phpstorm配置
在Preference->Languages&Frameworks->PHP->Debug中配置xdebug的debug port

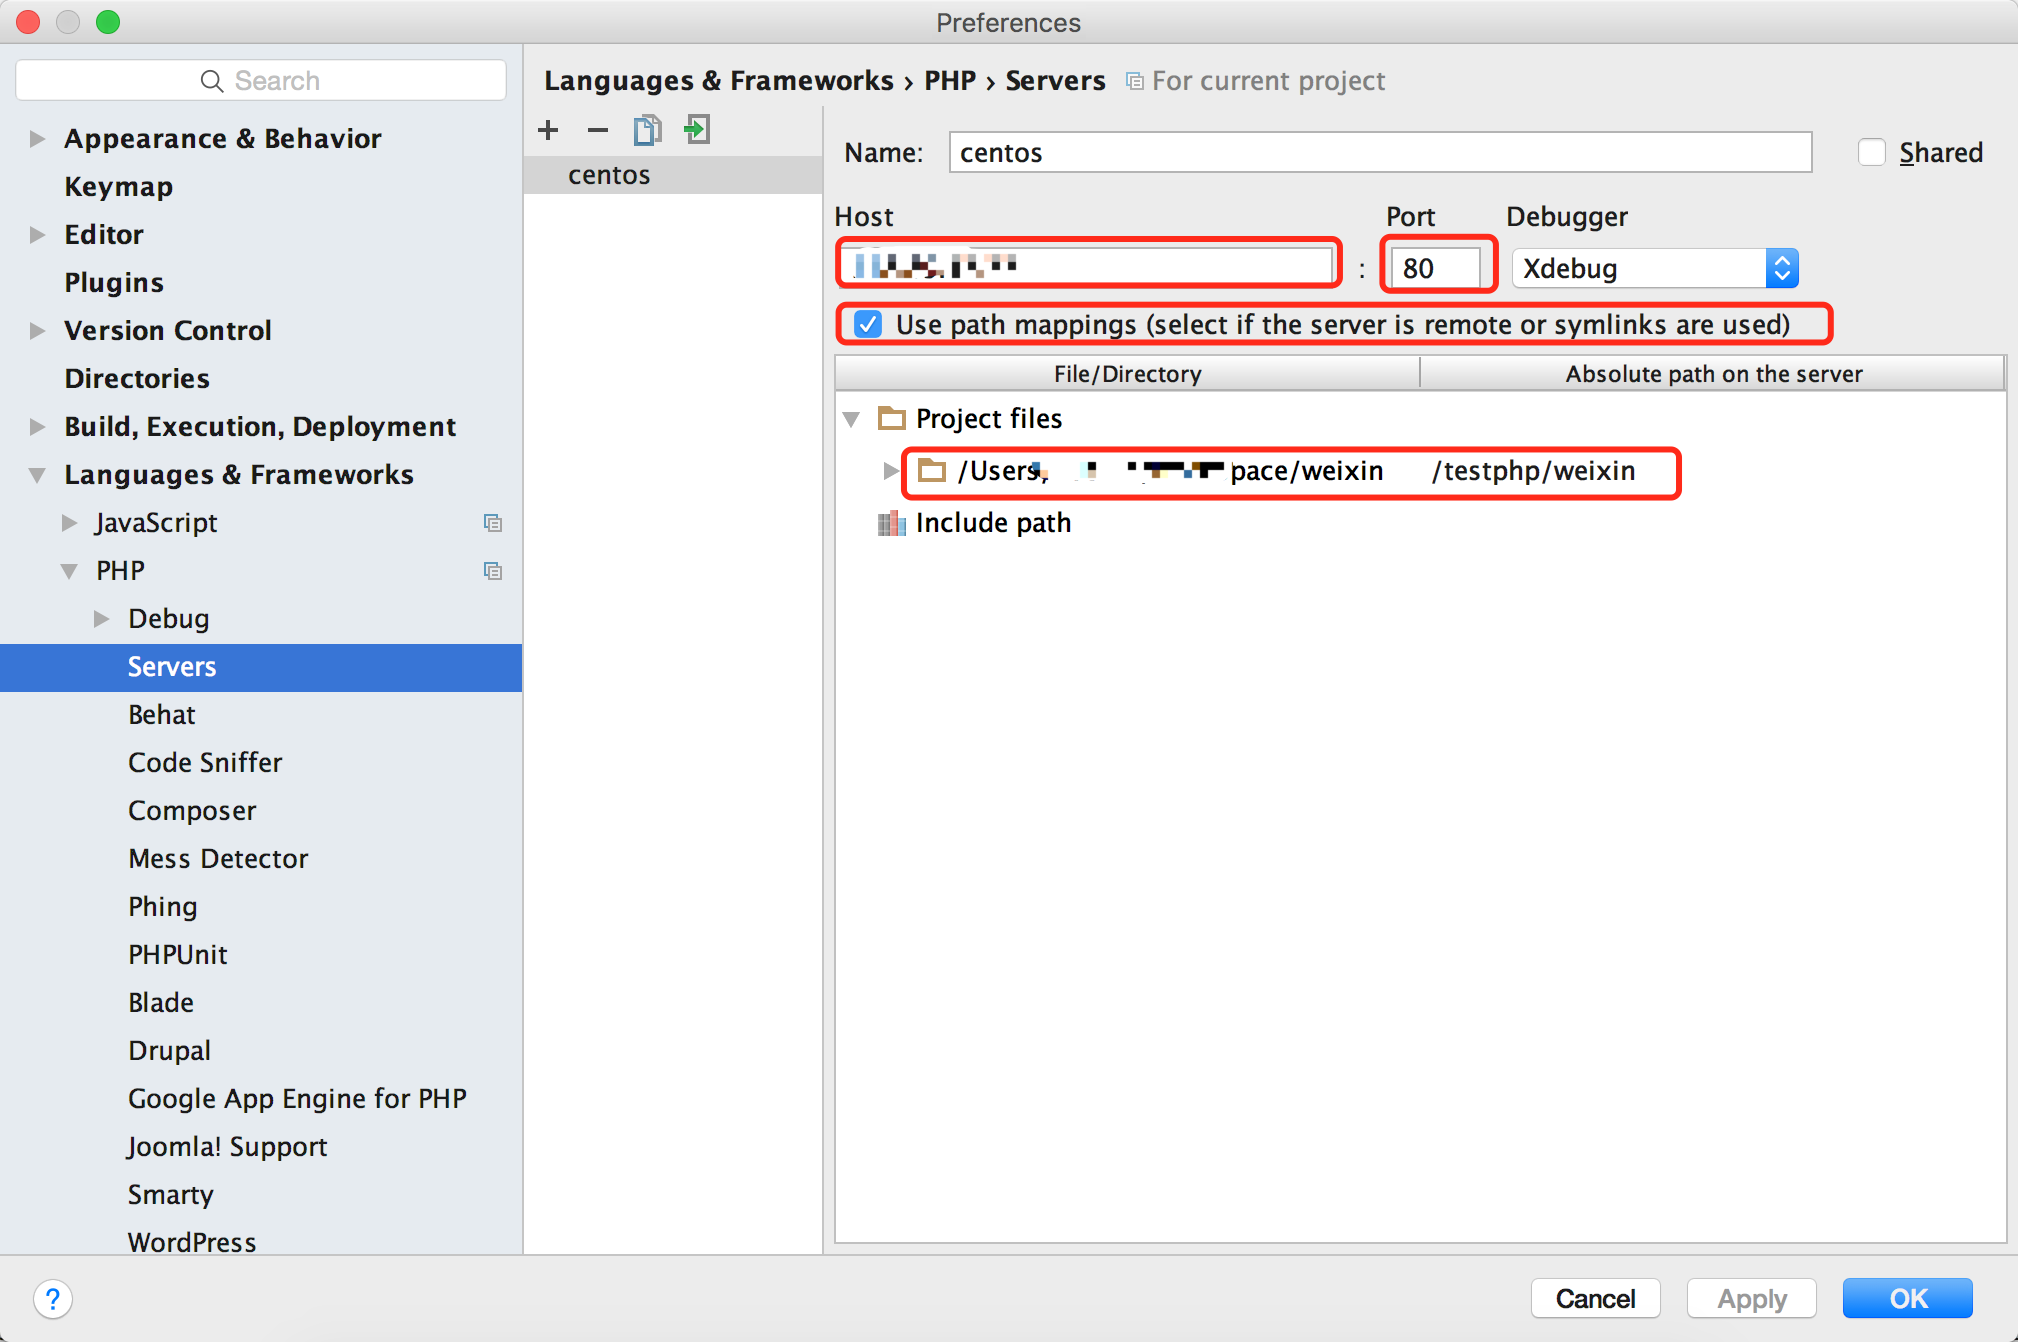
在Preference->Languages&Frameworks->PHP->Servers中设置xdebug server参数:
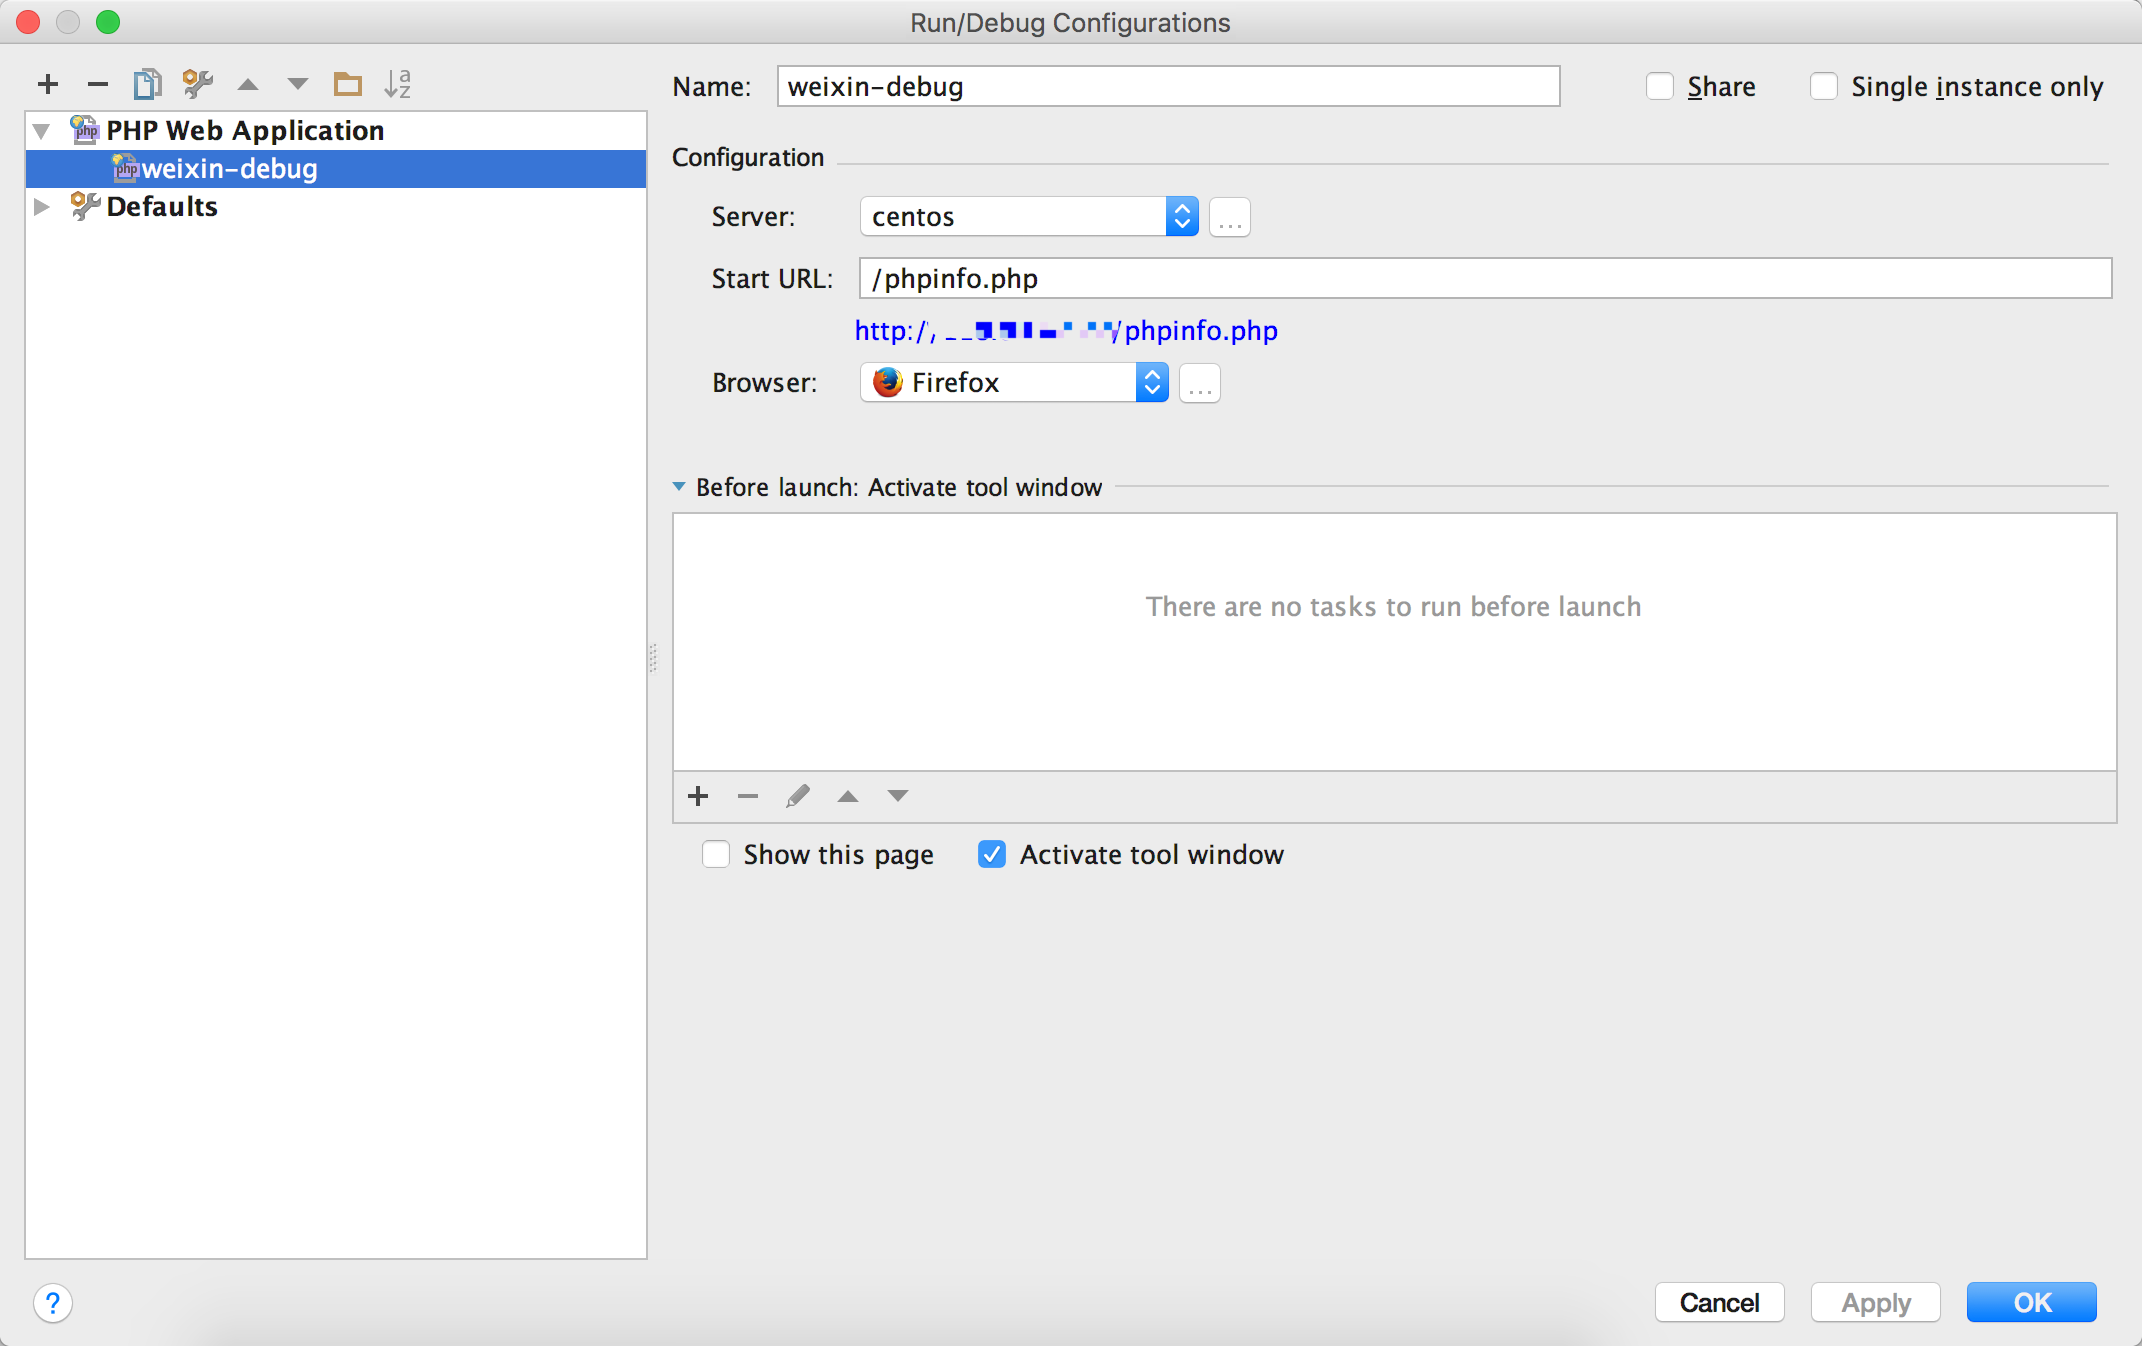
之后在Run/Debug Configurations中添加 PHP Web Application配置即可:
浏览器发送请求
输入对应url,并加上XDEBUG_SESSION_START=14982&XDEBUG_SESSION=phpstorm参数,触发调试。url例如:http://localhost/index.php?XDEBUG_SESSION_START=1&XDEBUG_SESSION=phpstorm
跨网段调试
(本部分针对phpstorm跨网段调试。因为vim+DBGp可以永远的处于同一个网段)
当你的web server和你的客户端不在同一个网段,你的客户端可以访问web server,但是web server由于NAT、防火墙等原因不能访问客户端所在主机时,不能进行远程调试。
不过,如果客户端所在主机可以和web server建立ssh连接,就可以利用ssh隧道的远端端口转发+xdebug With a static IP/single developer 调试实现跨网段调试。
实现原理:
由上面的With a static IP/single developer示例图可知,当xdebug server收到带有触发调试参数的请求后,会根据配置文件制定的remote_host、remote_port尝试与客户端建立DBGp连接。当跨网段时,xdebug server并不能访问到客户端。
不过通过ssh的远端端口转发功能,我们可以建立一个隧道,并将remote_host、remote_port设置为xdebug server的本地地址和本地端口,然后将该端口利用ssh远端端口转发功能映射至客户端的调试端口,这样xdebug server就可以通过访问本地端口实现与客户端建立DBGp连接的需求。
具体操作:
xdebug配置项设置:
remote_host = localhost
remote_port = 9002
建立ssh远端端口转发:
在客户端命令行执行命令:ssh -R 9002:localhost:9002 server_user@server_ip (该命令是指与server_ip主机建立ssh连接,并将在server_ip主机上接收到的目的地址是localhost的9002端口(指后一个9002)的数据包转发至客户端的9002端口(指前面的9002))
phpstorm配置:
phpstorm在配置好debug port和server后即可,只需要点击“Start Listening for PHP Debug Connections”按钮等待DBGp连接请求的到来即可。
远程调试参考文献:
1. xdebug 远程调试官方文档 https://xdebug.org/docs/remote
2. PhpStorm XDebug 远程调试
3. Remote debugging in PhpStorm via SSH tunnel phpstorm官方文档
4. 三种不同类型的ssh隧道 ssh隧道介绍
xdebug profiling php scripts
具体配置项参考前文及官方文档https://xdebug.org/docs/profiler
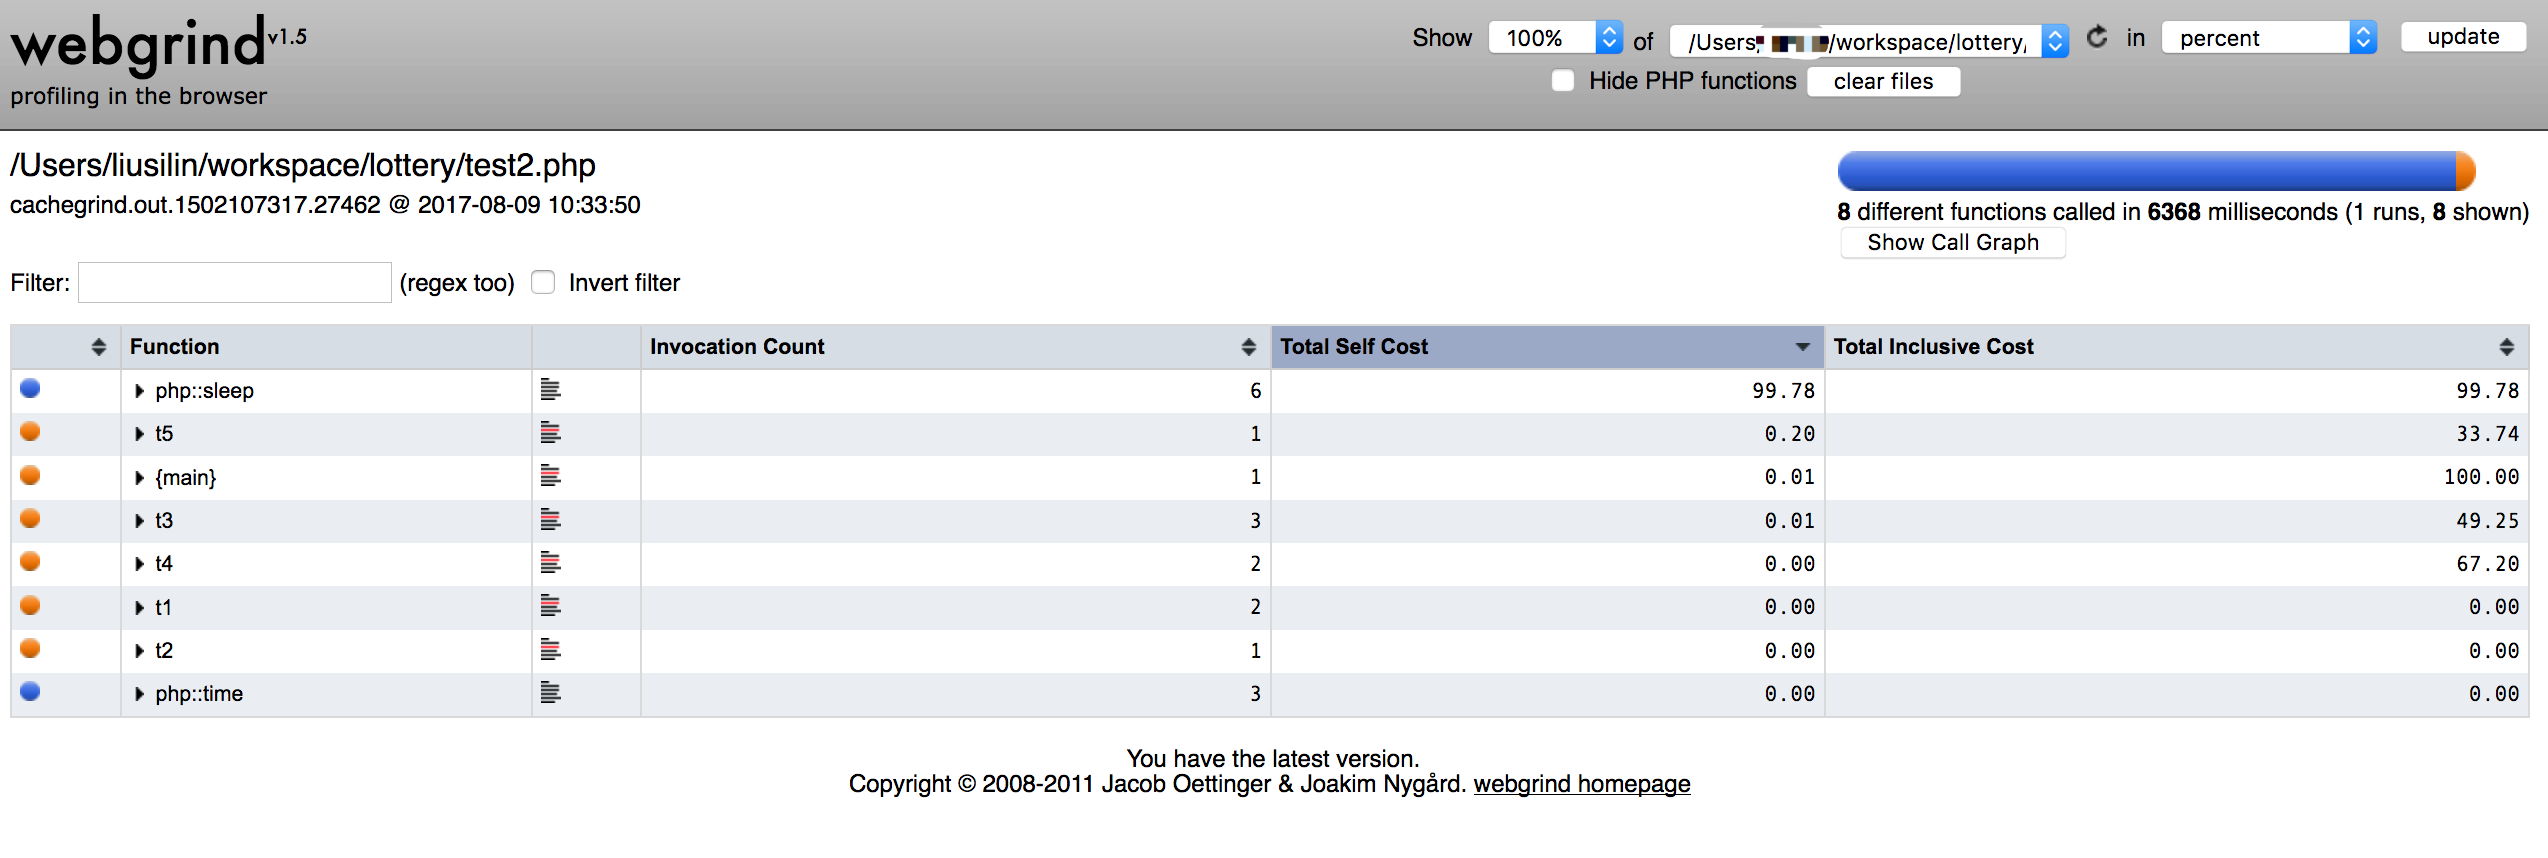
开启该功能后xdebug就会对php脚本进行性能分析,并在指定目录下按指定的文件名生成profiler_output文件。这就是xdebug profile的结果(The profiler in Xdebug 2 outputs profiling information in the form of a cachegrind compatible file. )。之后需要使用可视化工具来分析和查看结果。
常用的工具有 KCacheGrind (linux)、 WinCacheGrind.(windows)、WebGrind(web版,跨平台)等(还有其他工具,在xdebug 官网都有提及)。
我使用的是WebGrind
xdebug profile参考文献:
1. xdebug profile官方文档 https://xdebug.org/docs/profiler
2. WebGrind https://github.com/jokkedk/webgrind
3. webgrind安装使用详细说明
4. 用xdebug分析PHP以及结果分析程序webgrind的使用 (包含show call graph相关资料)