引入
cnpm install echarts --save
#在vue项目目录下安装echarts
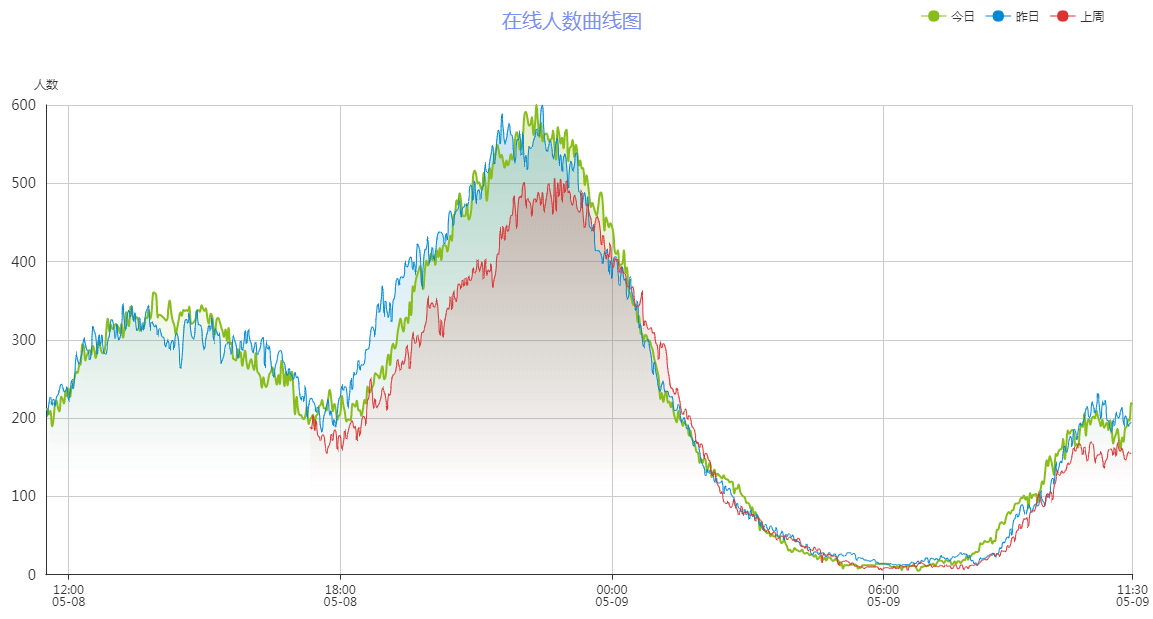
静态折线图

linechart.js
import echarts from 'echarts'

export const option = {
  // backgroundColor: 'rgba(57,64,86,0.02)',
  // 标题
  title: {
    text: '在线人数曲线图',
    x: 'center',
    textStyle: {
      fontWeight: 'normal',
      fontSize: 20,
      color: '#7a8ff3'
    }
  },
  // 鼠标悬浮提示框
  tooltip: {
    trigger: 'axis'
  },
  // 图示
  legend: {
    data: ['今日', '昨日', '上周'],
    right: '4%'
  },
  // 边框栅格
  grid: {
    top: 100,
    left: '2%',
    right: '2%',
    bottom: '2%',
    containLabel: true
  },
  // X轴
  xAxis: [{
    type: 'category',
    boundaryGap: false,
    data: ['13:00', '13:05', '13:10', '13:15', '13:20', '13:25', '13:30', '13:35', '13:40', '13:45', '13:50', '13:55']
  }],
  // Y轴
  yAxis: [{
    type: 'value',
    name: '人数',
    axisTick: {
      show: false
    },
    axisLabel: {
      margin: 10,
      textStyle: {
        fontSize: 14
      }
    }
  }],
  // 图示数据
  series: [{
    name: '今日',
    type: 'line',
    smooth: true,
    symbol: 'circle',
    symbolSize: 5,
    showSymbol: false,
    areaStyle: {
      normal: {
        color: new echarts.graphic.LinearGradient(0, 0, 0, 1, [{
          offset: 0,
          color: 'rgba(137, 189, 27, 0.3)'
        }, {
          offset: 0.8,
          color: 'rgba(137, 189, 27, 0)'
        }], false),
        shadowColor: 'rgba(0, 0, 0, 0.1)',
        shadowBlur: 10
      }
    },
    itemStyle: {
      normal: {
        color: 'rgb(137,189,27)',
        borderColor: 'rgba(137,189,2,0.27)',
        borderWidth: 12

      }
    },
    data: []
  }, {
    name: '昨日',
    type: 'line',
    smooth: true,
    symbol: 'circle',
    symbolSize: 5,
    showSymbol: false,
    lineStyle: {
      normal: {
         1
      }
    },
    areaStyle: {
      normal: {
        color: new echarts.graphic.LinearGradient(0, 0, 0, 1, [{
          offset: 0,
          color: 'rgba(0, 136, 212, 0.3)'
        }, {
          offset: 0.8,
          color: 'rgba(0, 136, 212, 0)'
        }], false),
        shadowColor: 'rgba(0, 0, 0, 0.1)',
        shadowBlur: 10
      }
    },
    itemStyle: {
      normal: {
        color: 'rgb(0,136,212)',
        borderColor: 'rgba(0,136,212,0.2)',
        borderWidth: 12
      }
    },
    data: []
  }, {
    name: '上周',
    type: 'line',
    smooth: true,
    symbol: 'circle',
    symbolSize: 5,
    showSymbol: false,
    lineStyle: {
      normal: {
         1
      }
    },
    areaStyle: {
      normal: {
        color: new echarts.graphic.LinearGradient(0, 0, 0, 1, [{
          offset: 0,
          color: 'rgba(219, 50, 51, 0.3)'
        }, {
          offset: 0.8,
          color: 'rgba(219, 50, 51, 0)'
        }], false),
        shadowColor: 'rgba(0, 0, 0, 0.1)',
        shadowBlur: 10
      }
    },
    itemStyle: {
      normal: {
        color: 'rgb(219,50,51)',
        borderColor: 'rgba(219,50,51,0.2)',
        borderWidth: 12
      }
    },
    data: []
  }]
}
chart.vue
<template>
  <div class="chart-container">
    <!--创建一个echarts的容器,给定高宽-->
    <div id="gamechart" style="100%; height:100%"/>
  </div>
</template>

<script>
// 安装echarts后,直接引入
import echarts from 'echarts'
import { option } from './linechart'

export default {
  data() {
    return {
      chart: {},
      option: option
    }
  },
  created() {
    this.fetchData()
  },
  // 挂载图表函数
  mounted() {
    this.initChart()
  },
  methods: {
    fetchData() {
      this.chart = {
        today: [220, 182, 191, 134, 150, 120, 110, 125, 145, 122, 165, 122],
        lastday: [120, 110, 125, 145, 122, 165, 122, 220, 182, 191, 134, 150],
        lastweek: [220, 182, 125, 145, 122, 191, 134, 150, 120, 110, 165, 122]
      }
      this.option.series[0].data = this.chart.today
      this.option.series[1].data = this.chart.lastday
      this.option.series[2].data = this.chart.lastweek
    },
    initChart() {
      // 将chart初始化的实例绑定到一个DOM
      this.chart = echarts.init(document.getElementById('gamechart'))
      this.chart.setOption(this.option)
    }
  }
}
</script>

<style scoped>
  .chart-container{
    position: relative;
     100%;
    height: calc(100vh - 84px);
  }
</style>
从后台获取数据
- echarts的时间戳格式是13位,精确到毫秒
- 后台给出的时间戳是变化的,所以在图表上,会展示最新时间的数据
[[[1557309121000,5901],[1557309241000,5962],[1557309361000,5992],[1557309480000,5983],[1557309600000,5949],[1557309720000,6047]]
#这是后台给出的api数据
#echarts可以从后台获取包含时间戳和数据的二维数组
  methods: {
    fetchData() {
      getGameChart(this.gameid).then(response => {
        this.option.series[0].data = response.today
        this.option.series[1].data = response.lastday
        this.option.series[2].data = response.lastweek
        this.chart.setOption(this.option)
        this.chart.hideLoading()
      }).catch(error => {
        this.$message.error('图表请求数据失败啦!')
        console.log(error)
      })
    },
    initChart() {
      // 将chart初始化的实例绑定到一个DOM
      this.chart = echarts.init(document.getElementById('gamechart'))
      this.chart.showLoading({
        text: '正在努力的读取数据中...'
      })
    }
  }
#在vue中请求后台api,然后将返回的数据赋值给this.option.series的几个数组