只使用Python的random库,将已有数据生成HTML格式的标签云。思路就是根据同一单词出现的次数多少,生成不同大小不同颜色单词的数据的视图。
比如以下格式的多条数据:
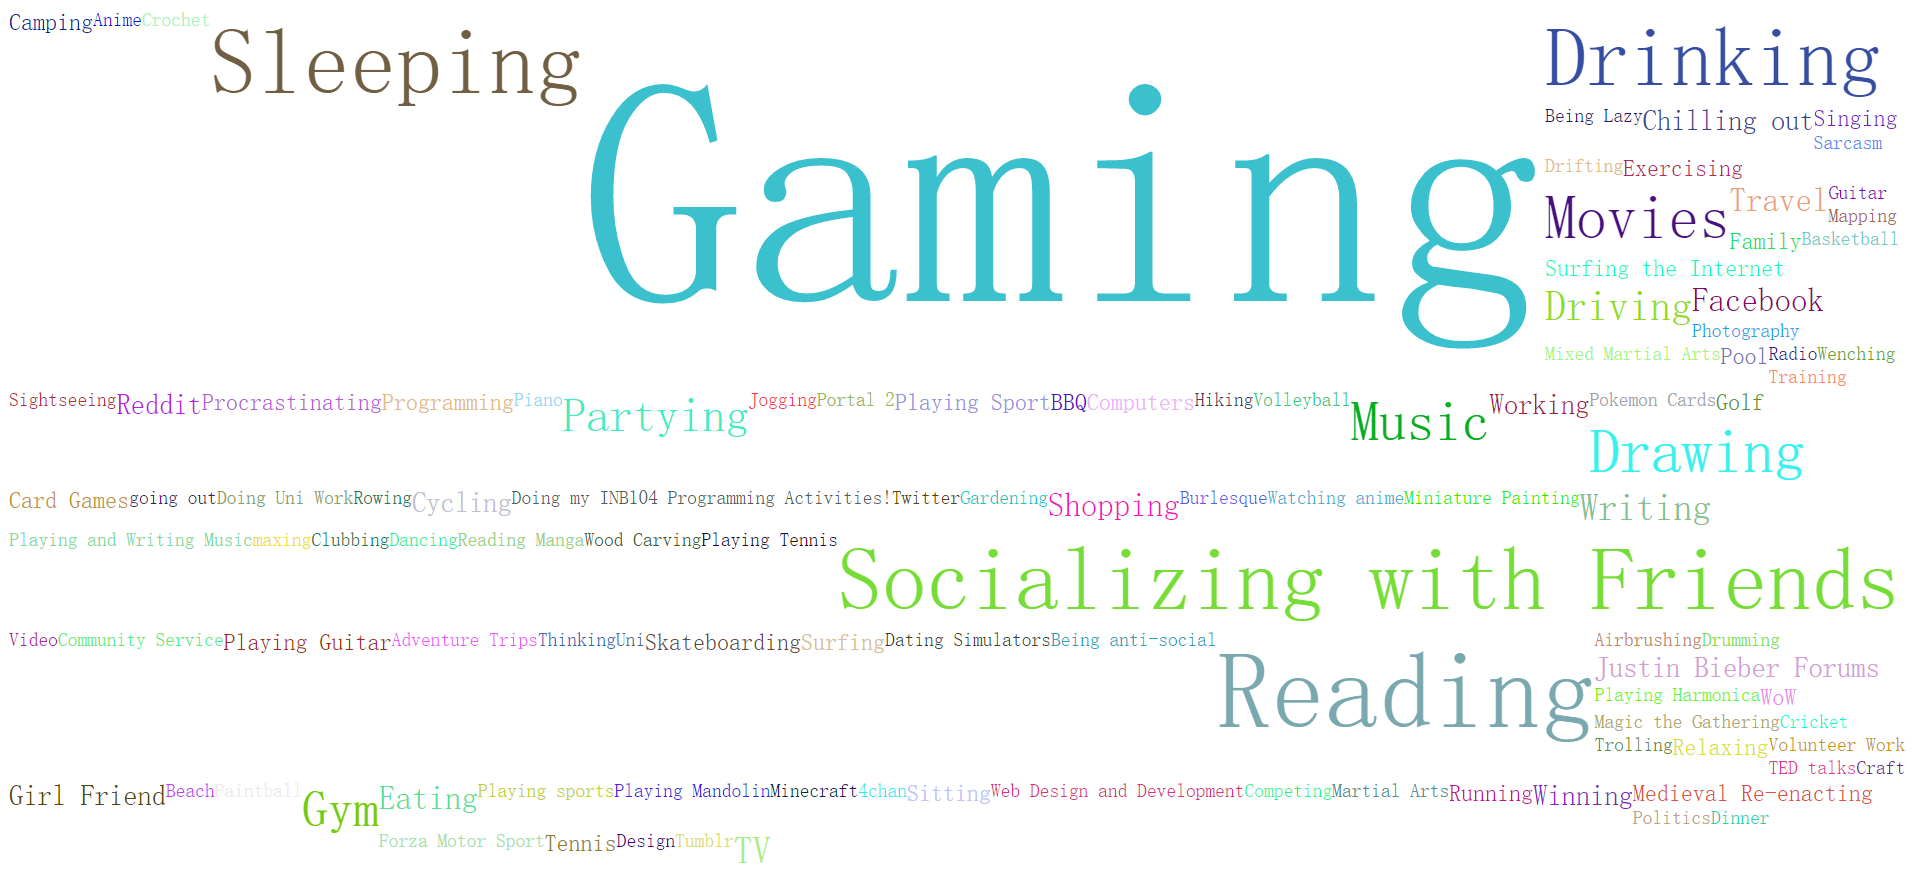
1	Gaming
1	Skateboarding
2	Girl Friend
3	Surfing the Internet
3	TED talks
4	Reading
4	Writing
5	Facebook
5	Gaming
6	Gaming
6	Martial Arts
7	Partying
7	Playing Sport
7	Travel
8	Driving
8	Socializing with Friends
9	Eating
9	Procrastinating
9	Sleeping
10	Winning
……
可制作成效果如下:
首先,将数据存在一个dict里,键为单词,值为出现的个数:
words = ''
for line in data:
    word = line.split('	')[1]
    if word not in words:
        words[word] = 1
    else:
        words[word] += 1
然后将制作HTML,将不同单词设置成随机的颜色,按单词出现的频率设置不同的字体大小。
html = ""
for w, c in words.items():
    color = 'rgb(%s, %s, %s)' % (str(random.randint(0, 255)), str(random.randint(0, 255)), str(random.randint(0, 255)))
    fontsize = int(c * 0.1 + 10)
    html += '<span style="font-size:' + str(fontsize) + 'px;color:' + color + ';float:left;">' + w + '</span>'

# dump it to a file
with open('result.html', 'wb') as f:
    f.write(bytes(html, 'UTF-8'))
到这里,已经完成了!