suppressPackageStartupMessages(library(ggpubr))
suppressPackageStartupMessages(library(ggplot2))
suppressPackageStartupMessages(library(ggrepel))
suppressPackageStartupMessages(library(ggthemes))
library(DESeq2)
options(stringsAsFactors = F)
sTart
rm(list =ls() )
setwd("C://Users/aklasim/Desktop/12s原核转录组结果/07.DiffExpAnnotation/1.GO")
rc_all <- read.table("C://Users/aklasim/Desktop/12s原核转录组结果/05.GeneExp/genes.read.txt")
class
counts <- as.matrix(rc_all)
rc_24 <- as.matrix(counts[,c(1:4)])
rc_3 <- counts[,c(5:8)]
rc_9 <- counts[,9:12]
condition
condition <- factor(c("trt","trt","untrt","untrt"))
col_data <- data.frame(row.names = colnames(rc_3), condition)
bb = (colnames())
dds <- DESeqDataSetFromMatrix(countData = rc_3, colData = col_data , design = ~ condition);
a
b
if (!file.exists(tem_f)) {
dds <- DESeq(dds) # 标准化
save(dds,file = tem_f)
}
load(file = tem_f)# 结果用result()函数提取
res <- results(dds,
contrast = c("condition","untrt","trt")) # 差异分析结果
resOrdered <- res[order(res$padj),] # 对结果按照调整后的p值进行排序
head(resOrdered)
summary(res)
DEG <- as.data.frame(resOrdered)
DESeq2_DEG <- na.omit(DEG)
diff <- subset(DESeq2_DEG,pvalue < 0.05) #先筛选P值
up <- subset(diff,log2FoldChange > 2) #上调
down <- subset(diff,log2FoldChange < -2) #下调
DEG_data <- DESeq2_DEG
DEG_data(logP <- -log10(DEG_data)padj) # 对差异基因矫正后p-value进行log10()转换
dim(DEG_data)
将基因分为三类:not-siginficant,up,dowm
将adj.P.value小于0.05,logFC大于2的基因设置为显著上调基因
将adj.P.value小于0.05,logFC小于-2的基因设置为显著上调基因
DEG_data(Group <- "not-siginficant"
DEG_data)Group[which((DEG_data(padj < 0.05) & DEG_data)log2FoldChange > 2)] = "up-regulated"
DEG_data(Group[which((DEG_data)padj < 0.05) & DEG_data(log2FoldChange < -2)] = "down-regulated"
table(DEG_data)Group)
write.csv(DEG_data,'24hbd.csv')
DEG_data <- DEG_data[order(DEG_data$padj),]#对差异表达基因调整后的p值进行排序
up_label <- head(DEG_data[DEG_data(Group == "up-regulated",],1)
down_label <- head(DEG_data[DEG_data)Group == "down-regulated",],1)
deg_label_gene <- data.frame(gene = c(rownames(up_label),rownames(down_label)),
label = c(rownames(up_label),rownames(down_label)))
DEG_data$gene <- rownames(DEG_data)
DEG_data <- merge(DEG_data,deg_label_gene,by = 'gene',all = T)
添加特定基因label
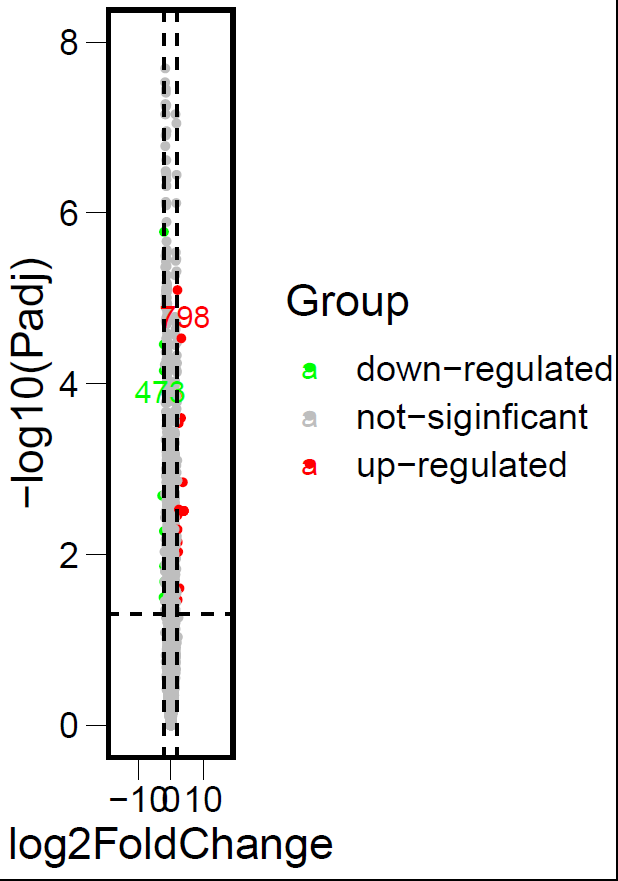
ggscatter(DEG_data,x = "log2FoldChange",y = "logP",
color = "Group",
palette = c("green","gray","red"),
label = DEG_data$gene,
repel = T,
ylab = "-log10(Padj)",
size = 1) +
theme_base()+
theme(element_line(size = 0),element_rect(size = 1.5))+ #坐标轴线条大小设置
scale_y_continuous(limits = c(0,8))+
scale_x_continuous(limits = c(-18,18))+
geom_hline(yintercept = 1.3,linetype = "dashed")+
geom_vline(xintercept = c(-2,2),linetype = "dashed")
火山图