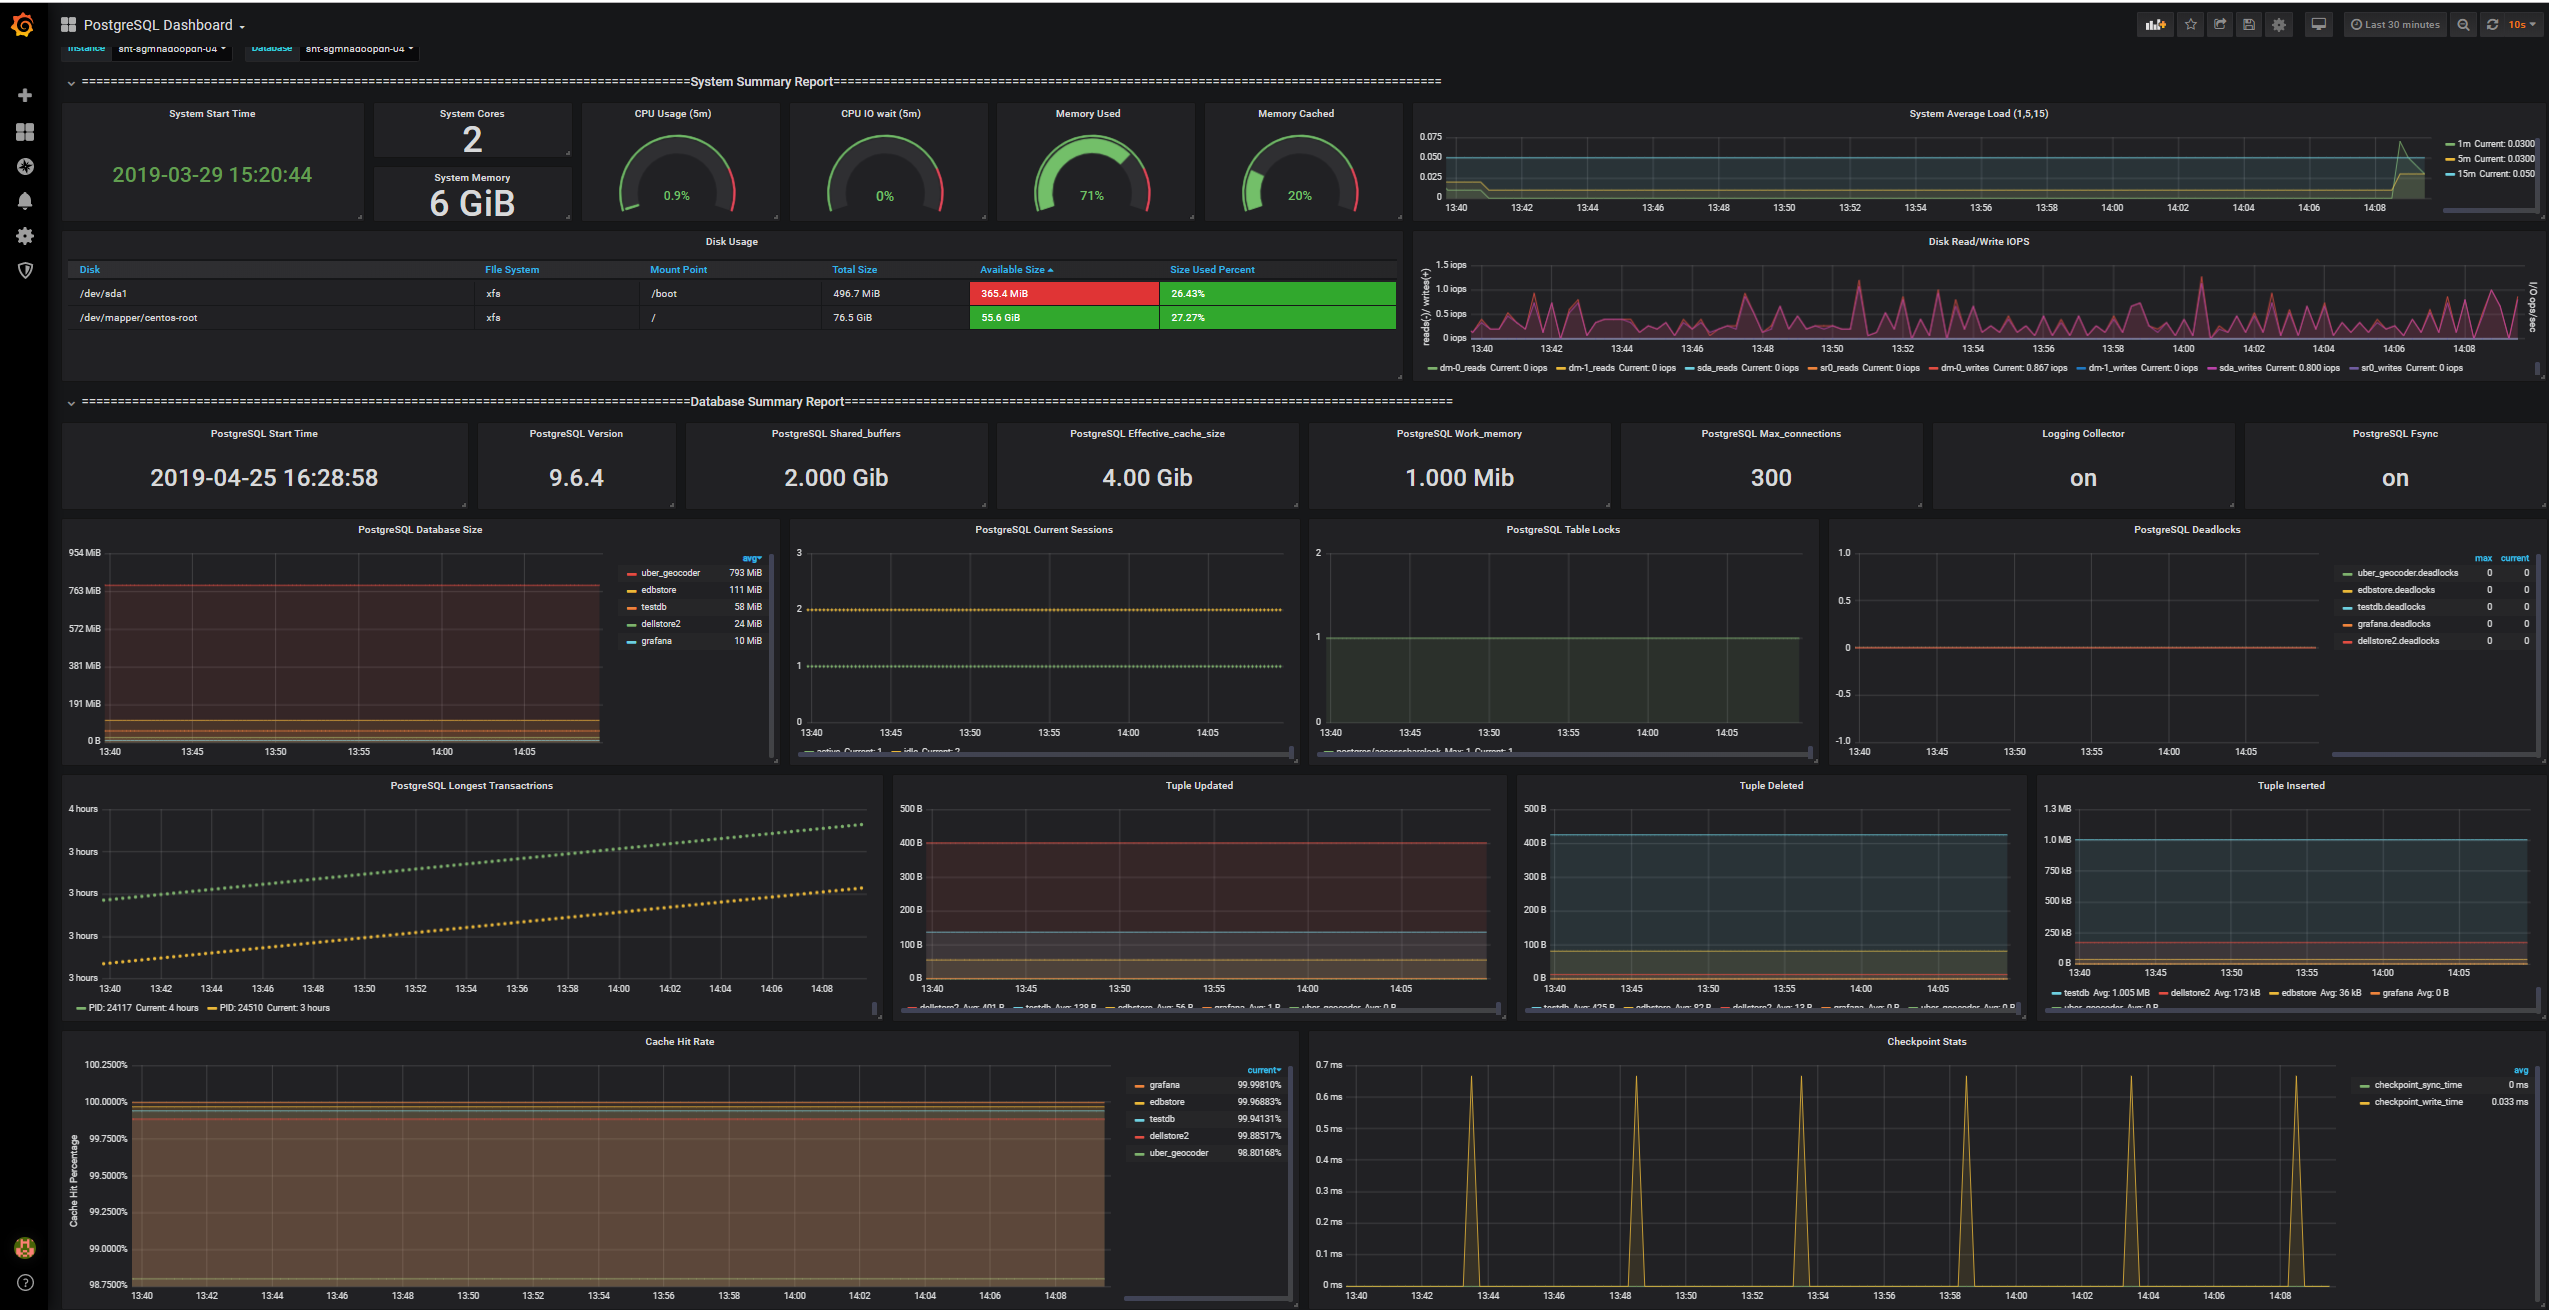
效果图
部署环境
| 服务器名称 | IP地址 | 监控指标 | 部署agent | 备注 |
| sht-sgmhadoopcm-01 | 172.16.101.54 |
OS |
node_exporter | 监控服务器、被监控服务器 |
| sht-sgmhadoopnn-01 | 172.16.101.55 |
OS |
node_exporter | 被监控服务器 |
| sht-sgmhadoopnn-02 | 172.16.101.56 | OS | node_exporter | 被监控服务器 |
| sht-sgmhadoopdn-01 | 172.16.101.58 | OS | node_exporter | 被监控服务器 |
| sht-sgmhadoopdn-02 | 172.16.101.59 | OS | node_exporter | 被监控服务器 |
| sht-sgmhadoopdn-03 | 172.16.101.60 |
OS PostgreSQL |
node_exporter postgres_exporter |
被监控服务器 |
| sht-sgmhadoopdn-04 | 172.16.101.66 |
OS PostgreSQL |
node_exporter postgres_exporter |
被监控服务器 |
安装目录
grafana /usr/local/grafana
prometheus /usr/local/prometheus
node_exporter /usr/local/prometheus/plugin
postgres_exporter /usr/local/prometheus/plugin/postgres_exporter
软件准备
- grafana
https://dl.grafana.com/oss/release/grafana-6.0.1.linux-amd64.tar.gz
- Prometheus
- Prometheus agent
node_exporter
postgres_exporter
https://github.com/wrouesnel/postgres_exporter
https://github.com/wrouesnel/postgres_exporter/releases
一 安装步骤
1.监控服务器安装Grafana
# tar -zxf grafana-6.0.1.linux-amd64.tar.gz
# mv grafana-6.0.1/* .
# rm -rf grafana-6.0.1*
修改conf/defaults.ini文件部分参数如下
data = /usr/local/grafana/data
logs = /usr/local/grafana/data/log
plugins = /usr/local/grafana/data/plugins
provisioning = /usr/local/grafana/conf/provisioning
启动grafana
# bin/grafana-server &
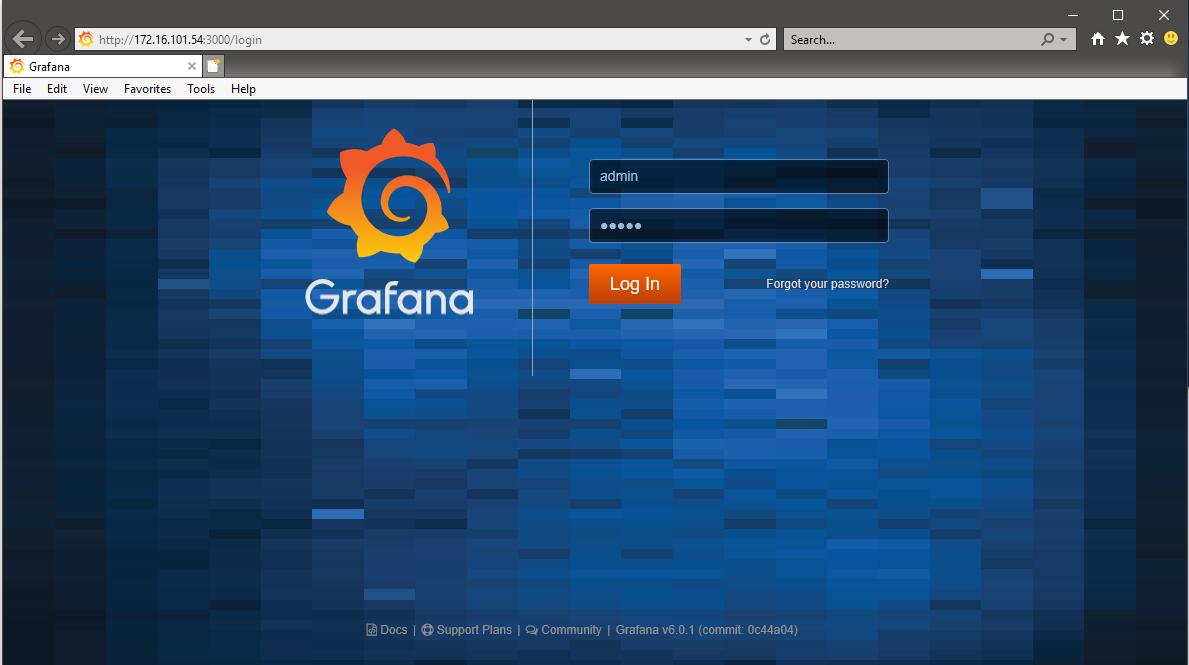
登录查看
默认账号密码admin/admin
2.监控服务器安装prometheus
--web.enable-lifecycle
作用:后期修改参数文件时不需要重启服务,可以通过api重新读取参数文件。
# tar -zxf prometheus-2.8.0.linux-amd64.tar.gz
# mv prometheus-2.8.0.linux-amd64/* .
# rm -rf prometheus-2.8.0.linux-amd64*
# ./prometheus --web.enable-lifecycle --web.enable-admin-api &
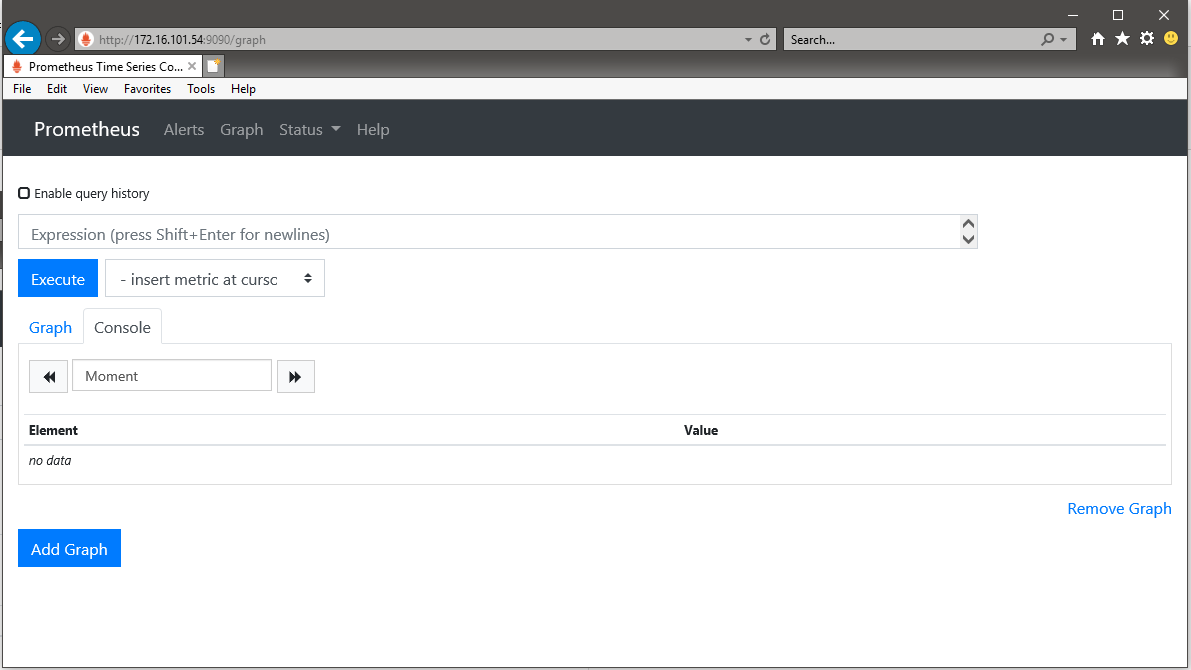
登录查看
3. 各节点安装agent
node_exporter
# tar -zxf node_exporter-0.17.0.linux-amd64.tar.gz
# mv node_exporter-0.17.0.linux-amd64 node_exporter
# rm -rf node_exporter-0.17.0.linux-amd64.tar.gz
# node_exporter/node_exporter &
postgres_exporter
该插件还未集成prometheus官网,需要从github下载.,分别下载源码文件,注意postgres_exporter二进制执行文件并不在该源码包里,需要单独下载。
源码 https://github.com/wrouesnel/postgres_exporter
二进制执行文件https://github.com/wrouesnel/postgres_exporter/releases
加入我自己定义的部分sql到custom.yaml文件
# cp queries.yaml custom.yaml
pg_stat_connetion:
  query: "select state,count(*) from pg_stat_activity group by state"
  metrics:
    - state:
        usage: "LABEL"
        description: "type of session state"
    - num:
        usage: "GAUGE"
        description: "type of session state"

pg_stat_long:
   query: "SELECT pid, runtime from (select usename, pid, EXTRACT(EPOCH FROM (now() - query_start))::INT as runtime FROM pg_stat_activity) as ss where runtime > 180 order by runtime desc limit 5"
   metrics:
     - pid:
         usage: "LABEL"
         description: "Pid of the client"
     - runtime:
         usage: "GAUGE"
         description: "current transactrion start time"
启动postgres_exporter
# export DATA_SOURCE_NAME="postgresql://dbadmin:1qax2wse@172.16.101.54:5432/postgres?sslmode=disable"
# export PG_EXPORTER_EXTEND_QUERY_PATH="/usr/local/prometheus/plugin/postgres_exporter/custom.yaml"
# ./postgres_exporter &
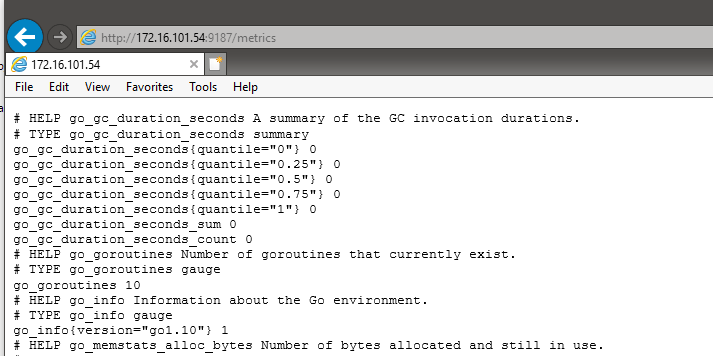
查看postgre_exporter
4. prometheus添加agent节点
prometheus.yml


# my global config
global:
  scrape_interval:     15s # Set the scrape interval to every 15 seconds. Default is every 1 minute.
  evaluation_interval: 15s # Evaluate rules every 15 seconds. The default is every 1 minute.
  # scrape_timeout is set to the global default (10s).

# Alertmanager configuration
alerting:
  alertmanagers:
  - static_configs:
    - targets:
      # - alertmanager:9093

# Load rules once and periodically evaluate them according to the global 'evaluation_interval'.
rule_files:
  # - "first_rules.yml"
  # - "second_rules.yml"

# A scrape configuration containing exactly one endpoint to scrape:
# Here it's Prometheus itself.
scrape_configs:
  # The job name is added as a label `job=<job_name>` to any timeseries scraped from this config.


- job_name: 'promethus'
  static_configs:
     - targets: ['172.16.101.54:9090']
       labels:
        instance: 'sht-sgmhadoopcm-01'
        platform: 'sh'

- job_name: 'system'
  static_configs:
     - targets: ['172.16.101.54:9100']
       labels:
        instance: 'sht-sgmhadoopcm-01'
        platform: 'ec2'
     - targets: ['172.16.101.55:9100']
       labels:
        instance: 'sht-sgmhadoopnn-01'
        platform: 'ec2'
     - targets: ['172.16.101.56:9100']
       labels:
        instance: 'sht-sgmhadoopnn-02'
        platform: 'ec2'
     - targets: ['172.16.101.58:9100']
       labels:
        instance: 'sht-sgmhadoopdn-01'
        platform: 'ec2'
     - targets: ['172.16.101.59:9100']
       labels:
        instance: 'sht-sgmhadoopdn-02'
        platform: 'ec2'
     - targets: ['172.16.101.60:9100']
       labels:
        instance: 'sht-sgmhadoopdn-03'
        platform: 'ec2'
     - targets: ['172.16.101.66:9100']
       labels:
        instance: 'sht-sgmhadoopdn-04'
        platform: 'ec2'

- job_name: 'postgres'
  static_configs:
     - targets: ['172.16.101.66:9187']
       labels:
        instance: 'sht-sgmhadoopdn-04'
        platform: 'ec2'
     - targets: ['172.16.101.60:9187']
       labels:
        instance: 'sht-sgmhadoopdn-03'
        platform: 'ec2'
重新载入配置文件
# curl -X POST http://172.16.101.54:9090/-/reload
level=info ts=2019-03-16T15:18:16.149076153Z caller=main.go:724 msg="Loading configuration file" filename=prometheus.yml
level=info ts=2019-03-16T15:18:16.152481657Z caller=main.go:751 msg="Completed loading of configuration file" filename=prometheus.yml
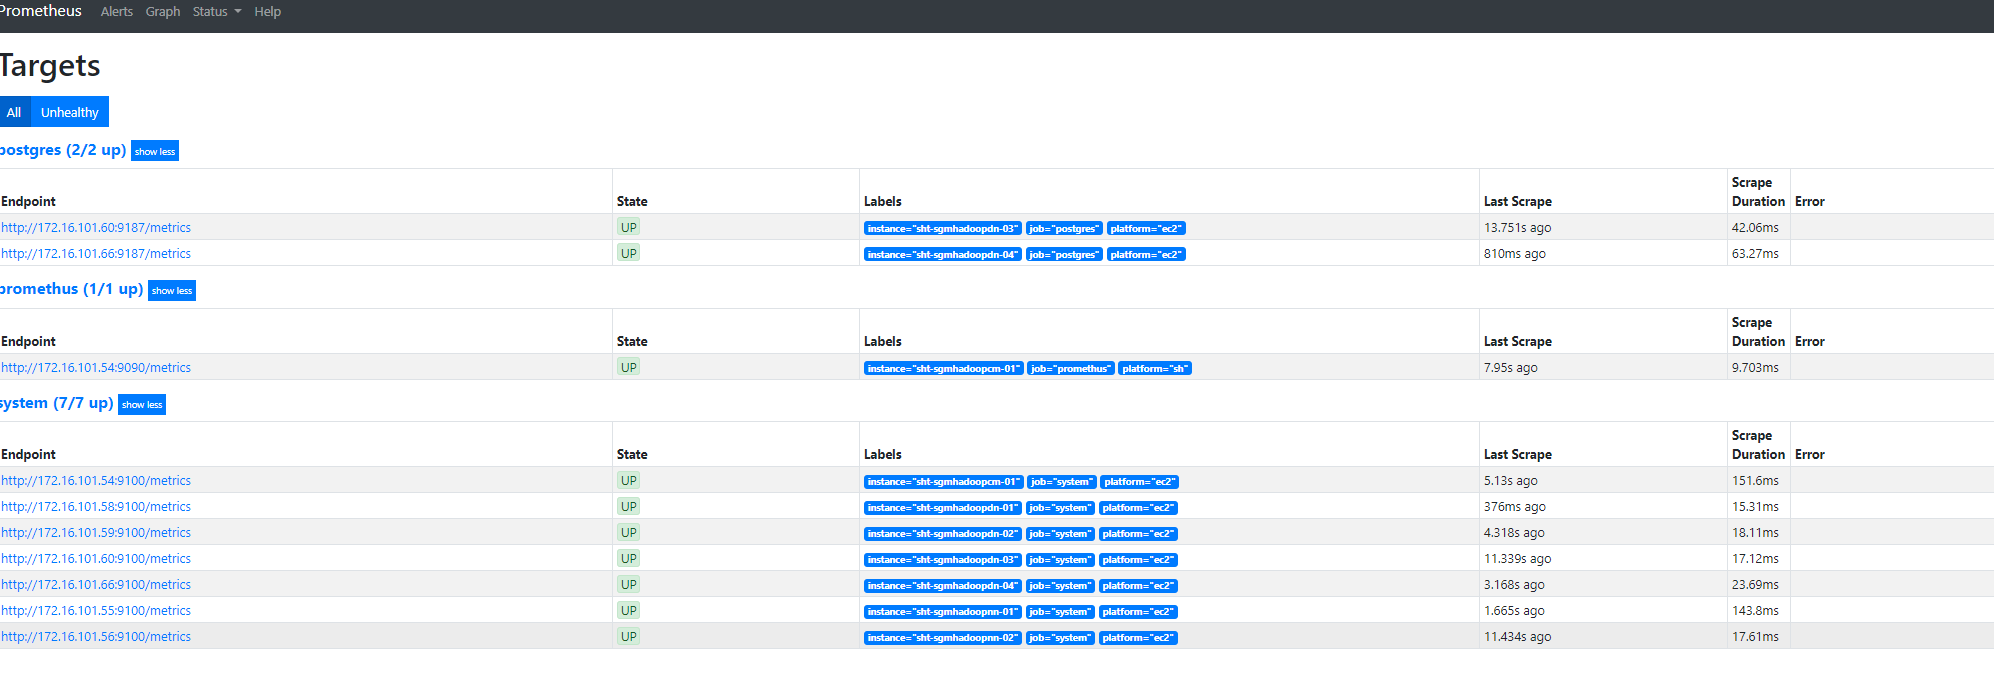
登录prometheus验证
二. 部署grafana
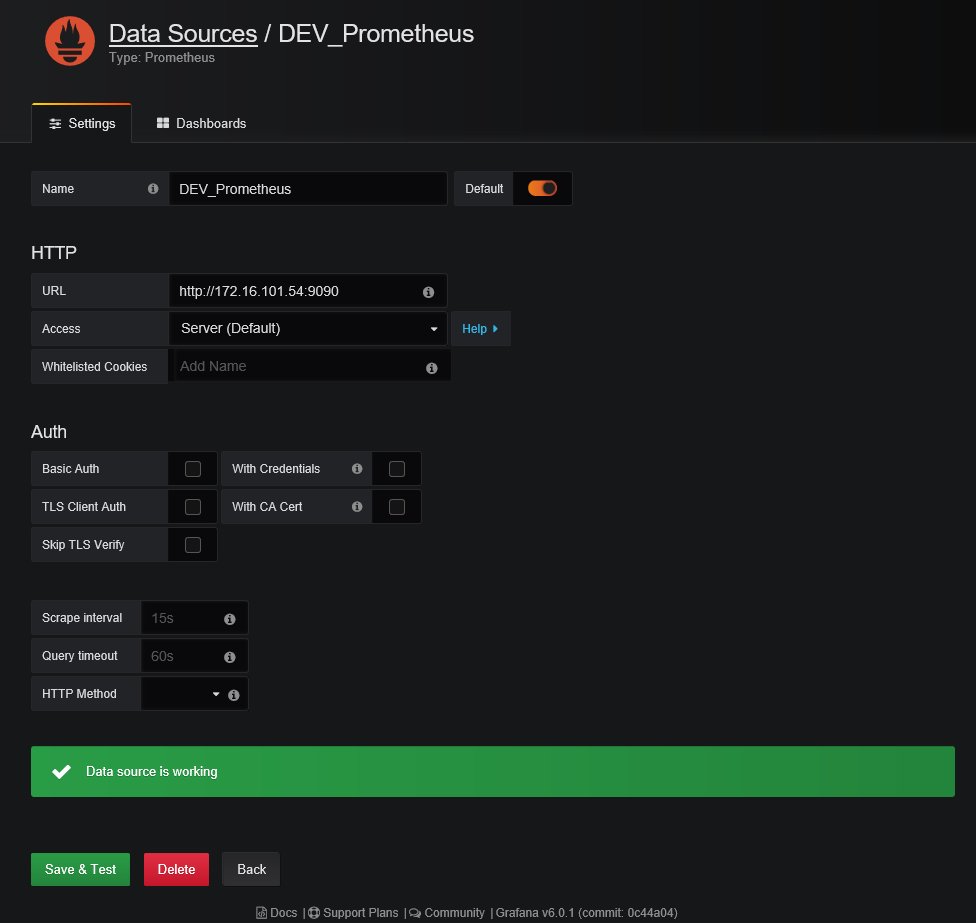
1. 添加prometheus数据源
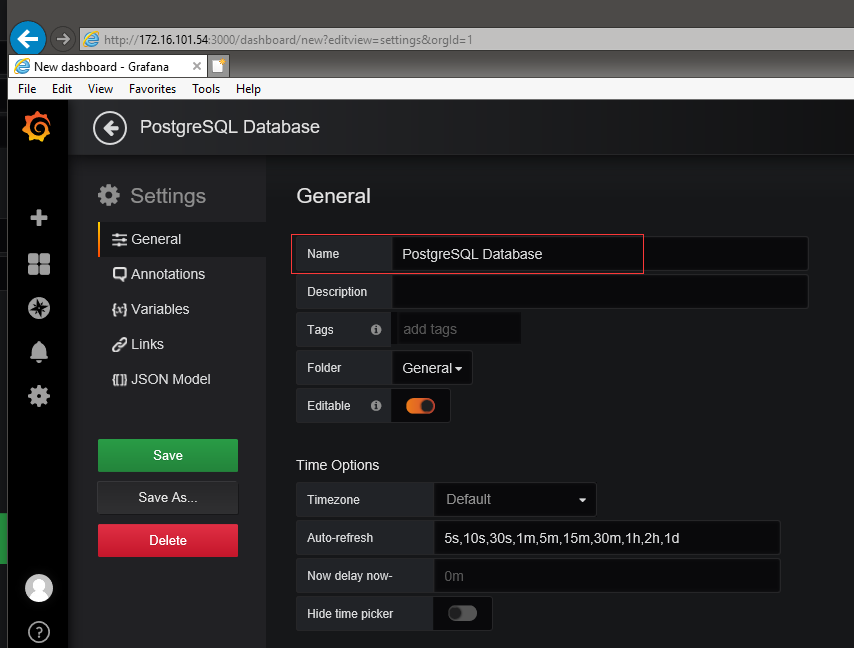
2.建立dashboard
dashbord名称
添加变量,把改dashborad作为模板使用
变量instance,获得server的node_exporter
变量database,获得server的postgres_exporter

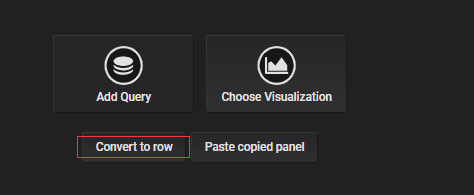
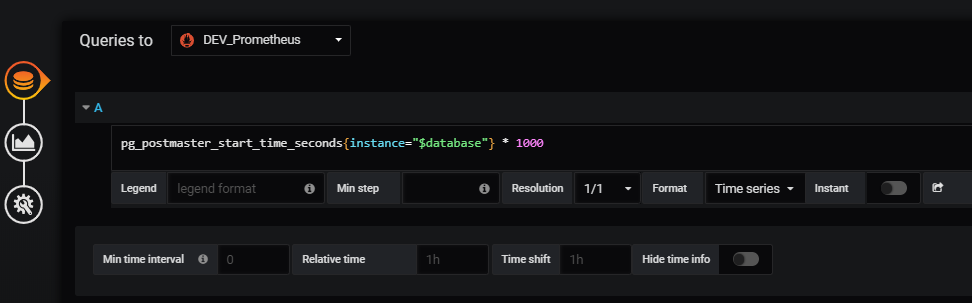
3.添加查询
系统监控
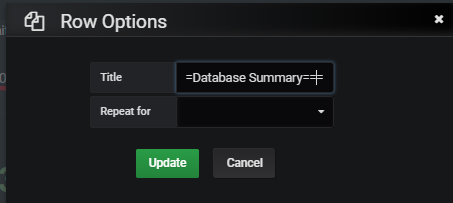
添加row
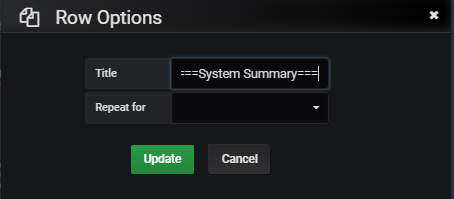
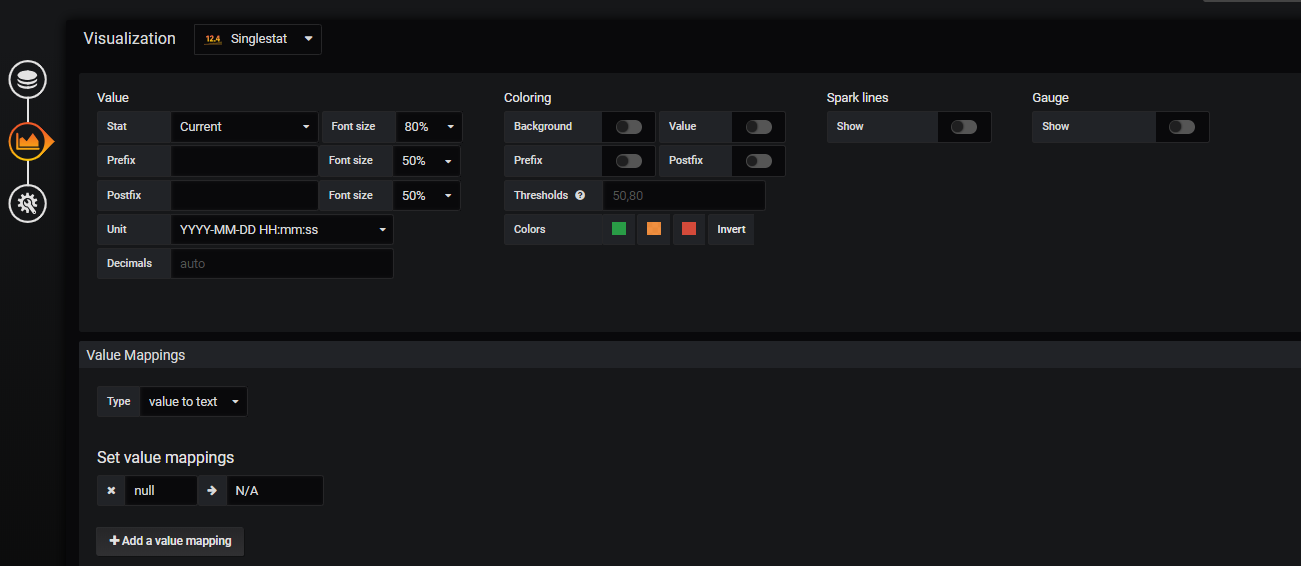
1)system start time

2)CPU Cores


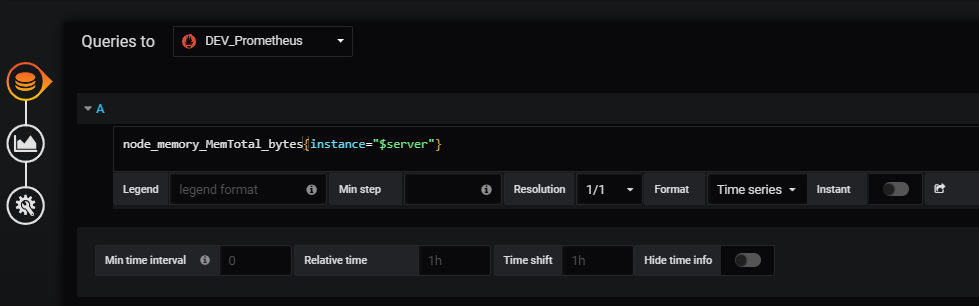
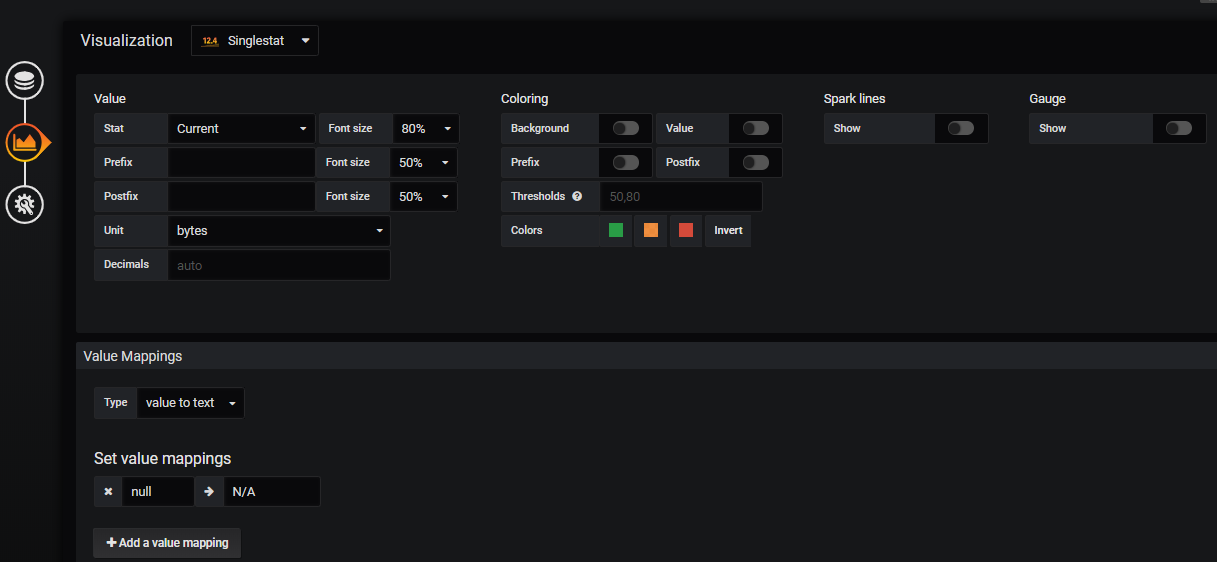
3)Memory Size
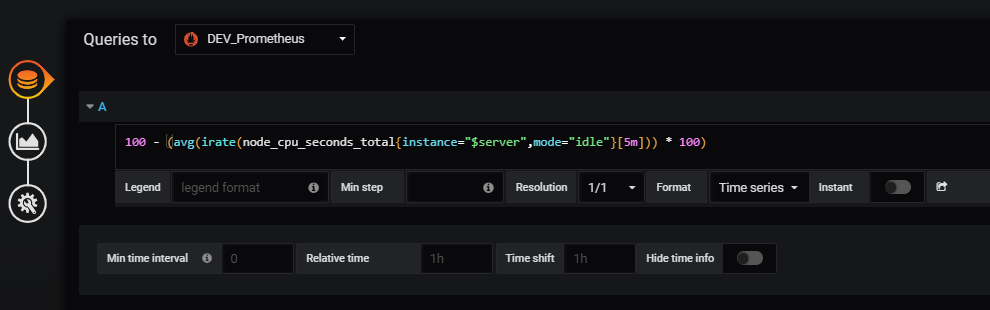
4) CPU Usage (5m)

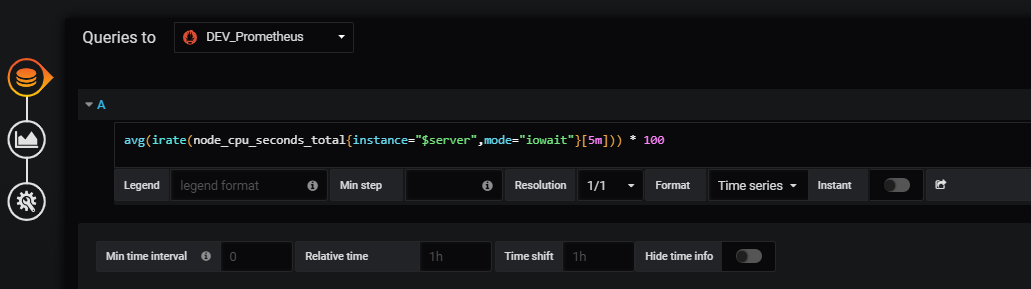
5) CPU IO Wait (5m)
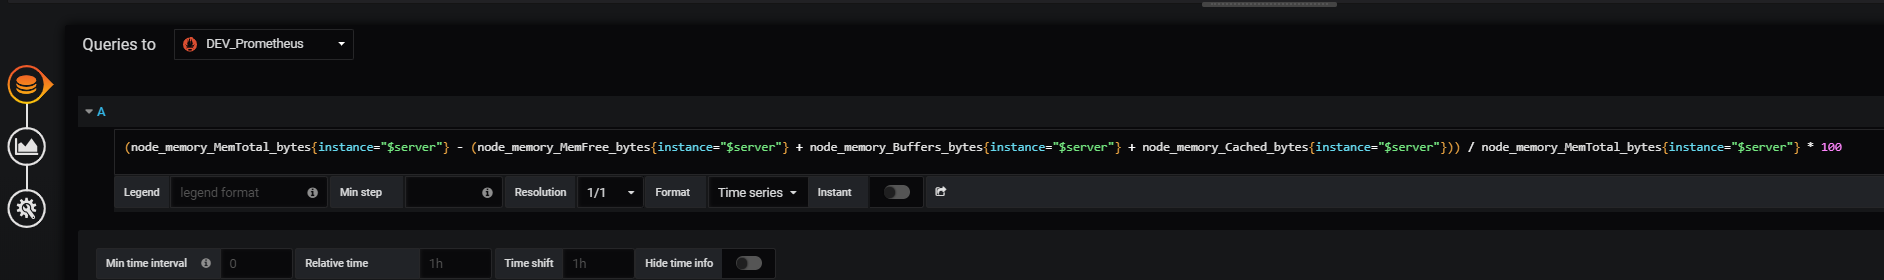
6) Memory Used
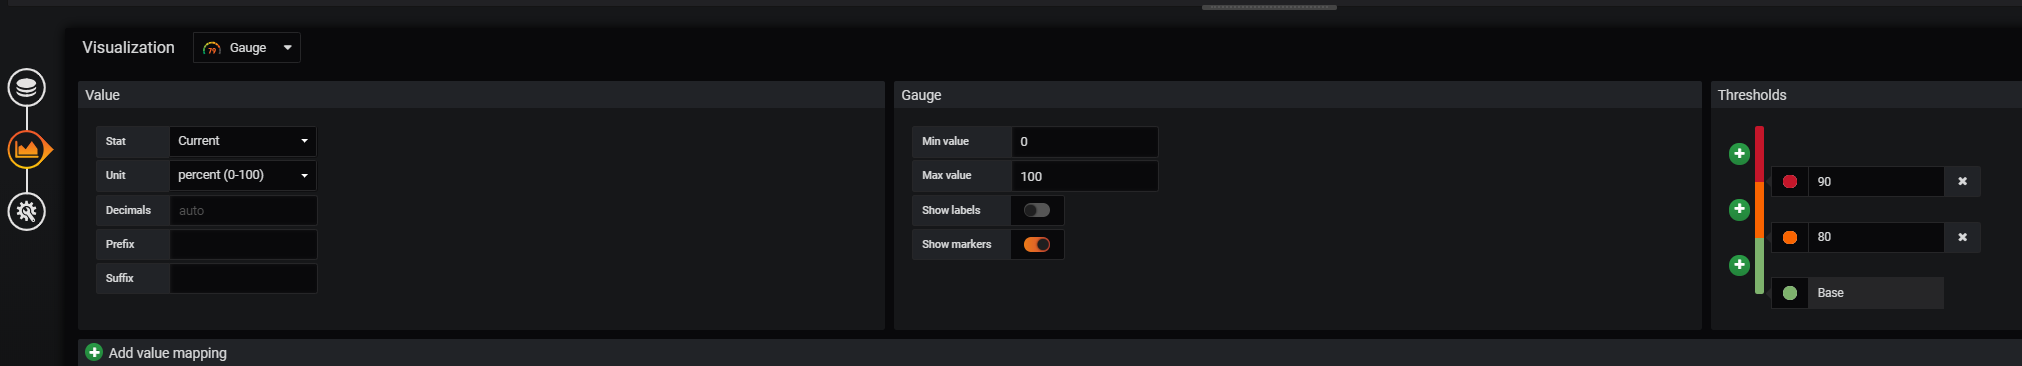
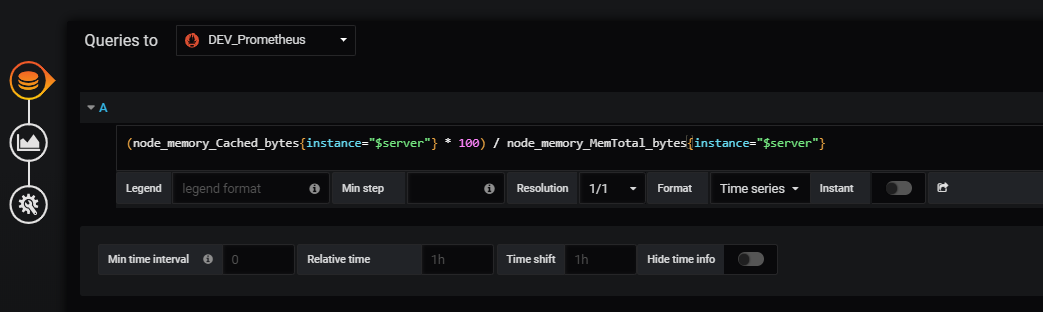
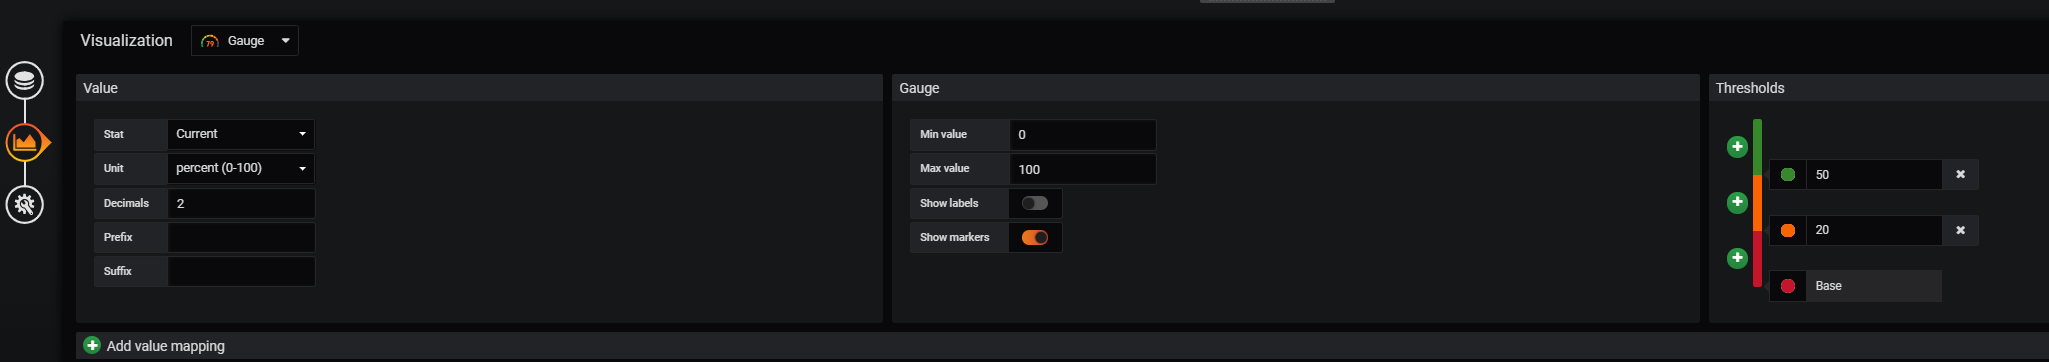
7) Memory Cached
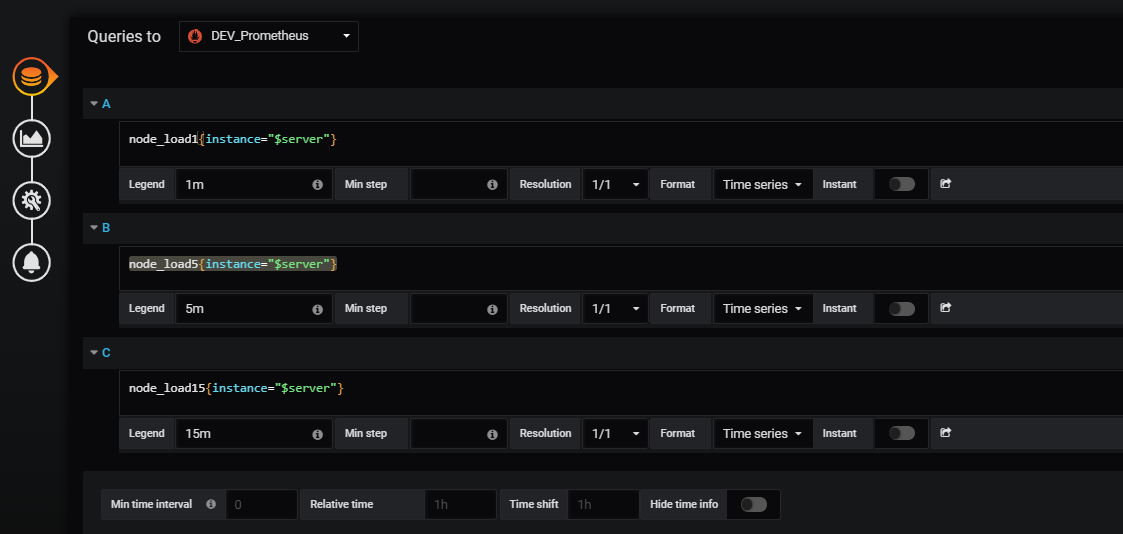
8)System Average Load (1,5,15)
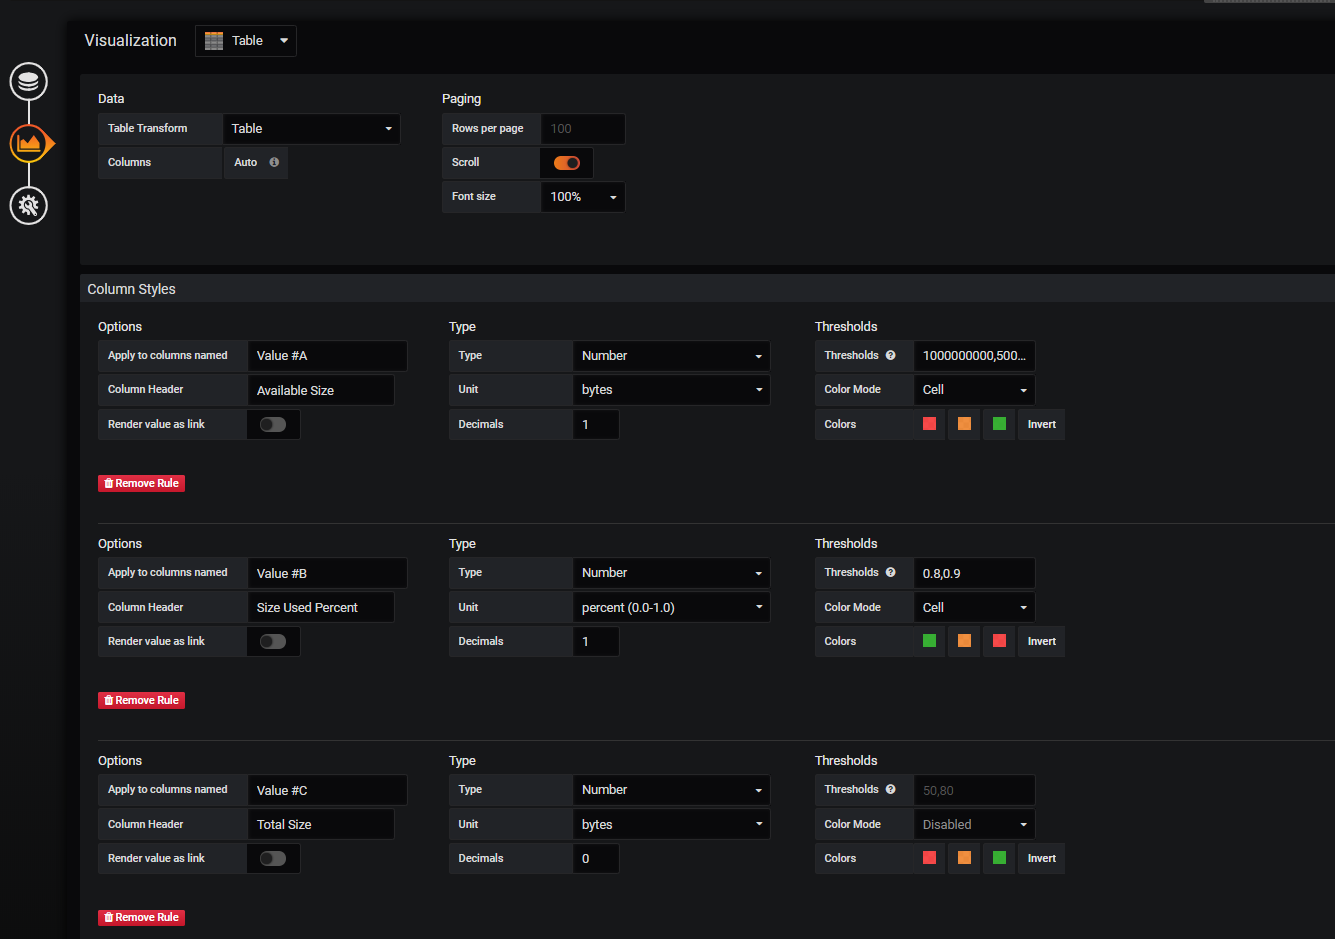
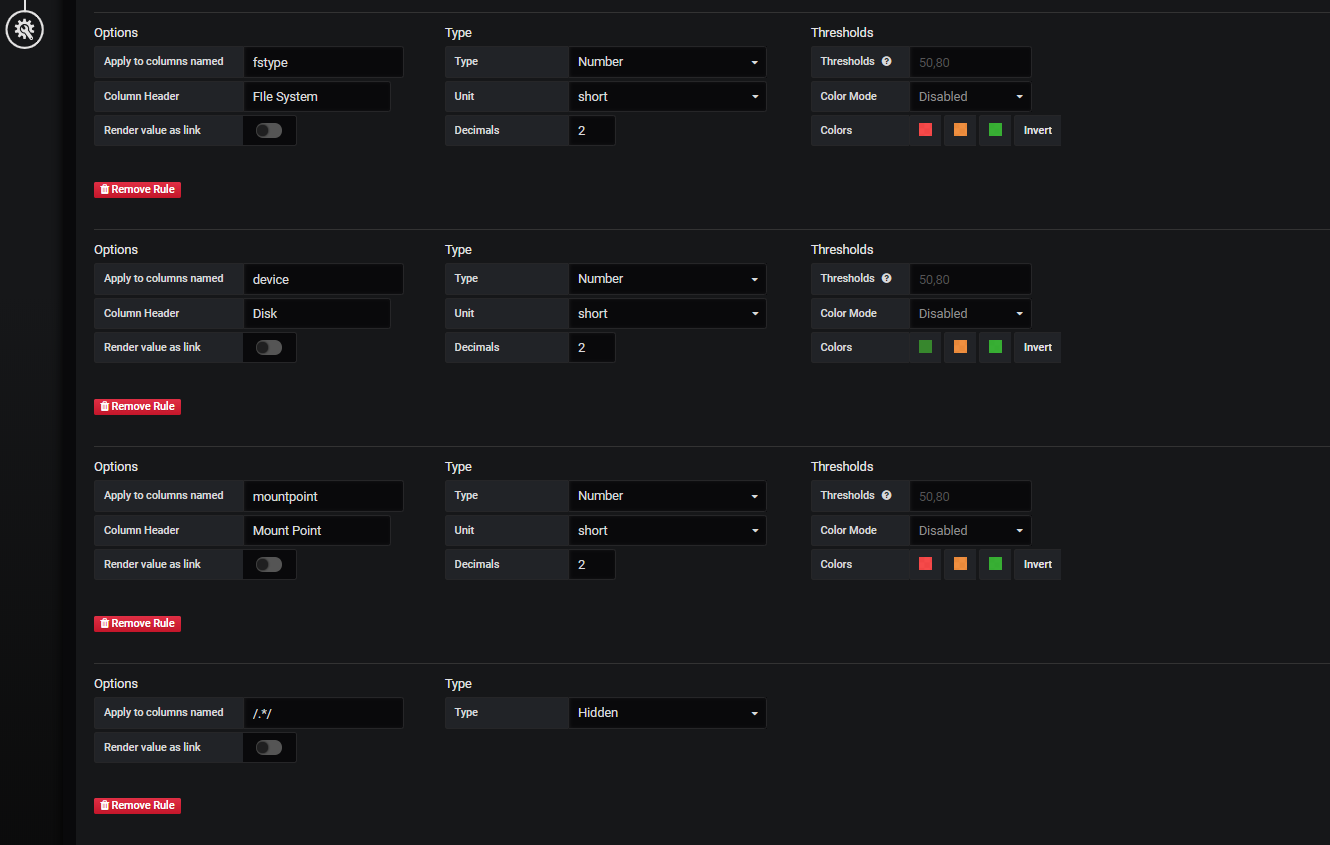
9) DIsk Usage

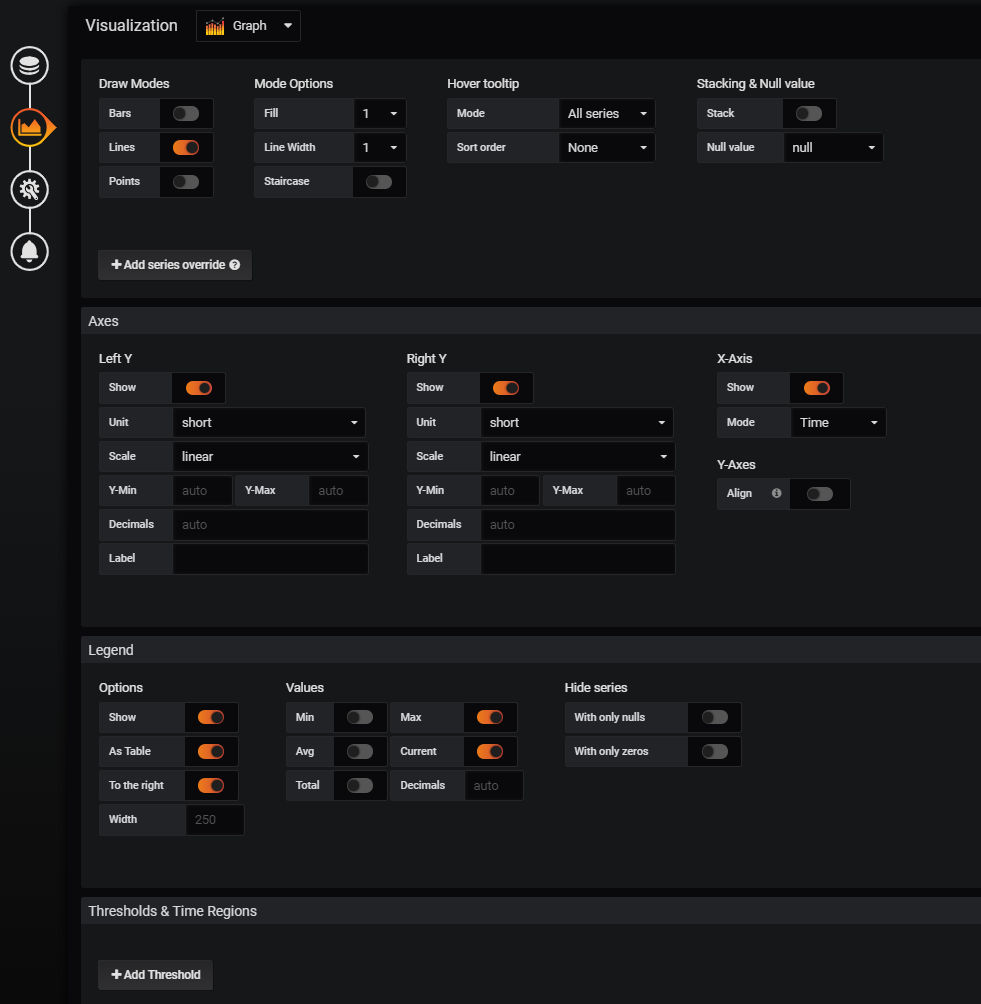
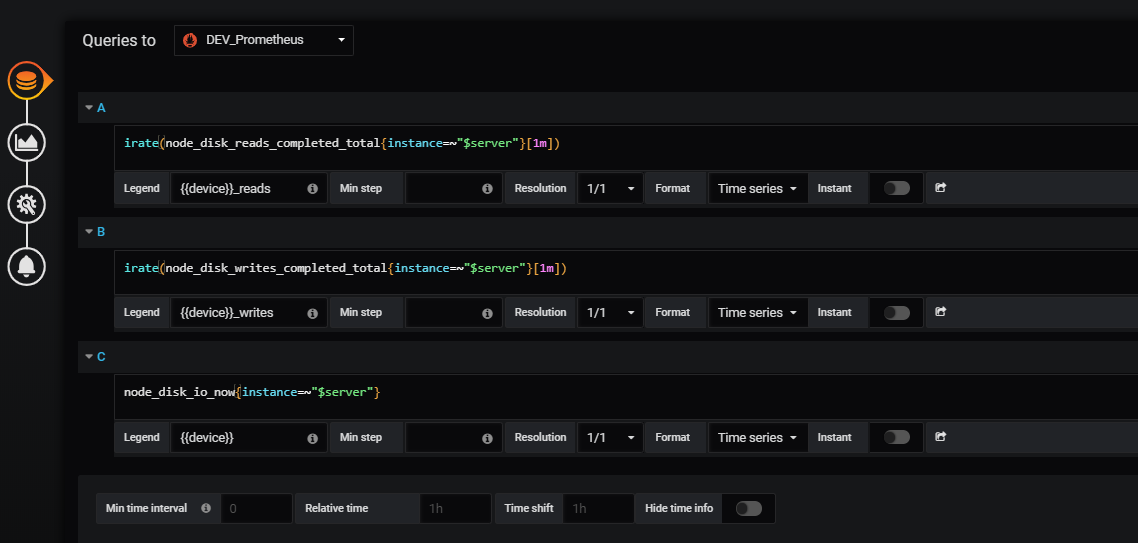
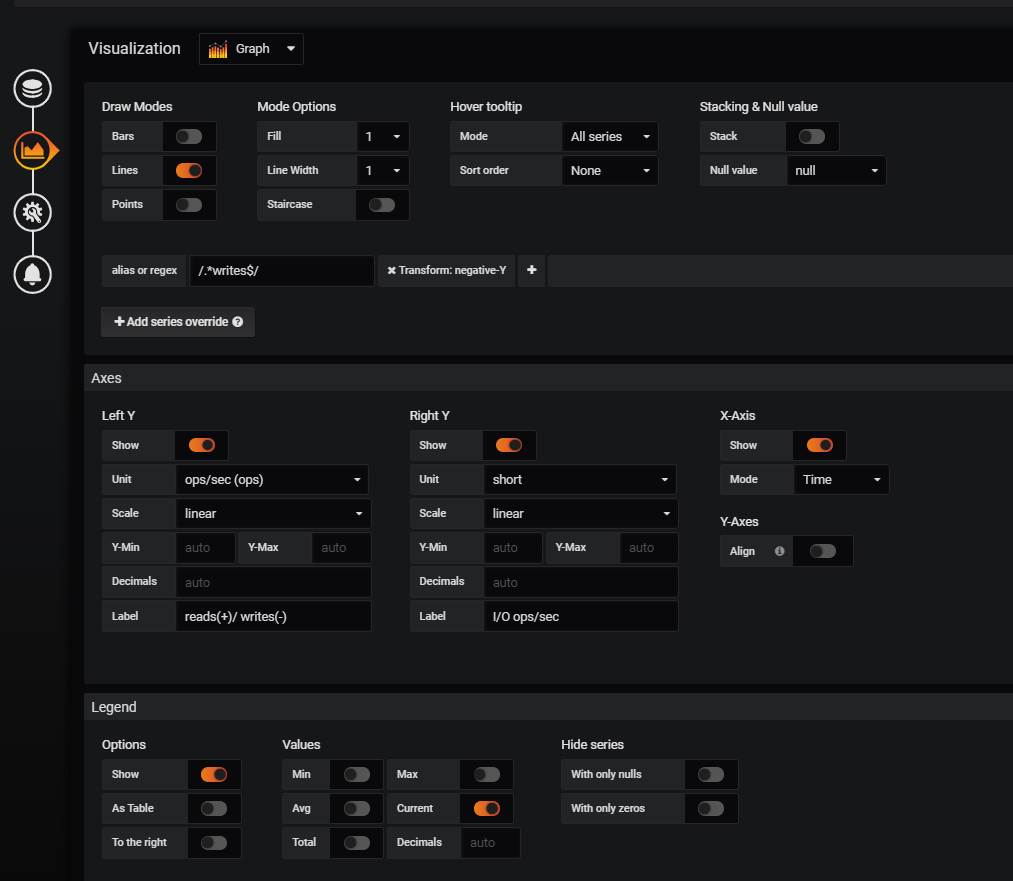
10) Disk Read/Write IOPS (1m)
数据库监控
添加row
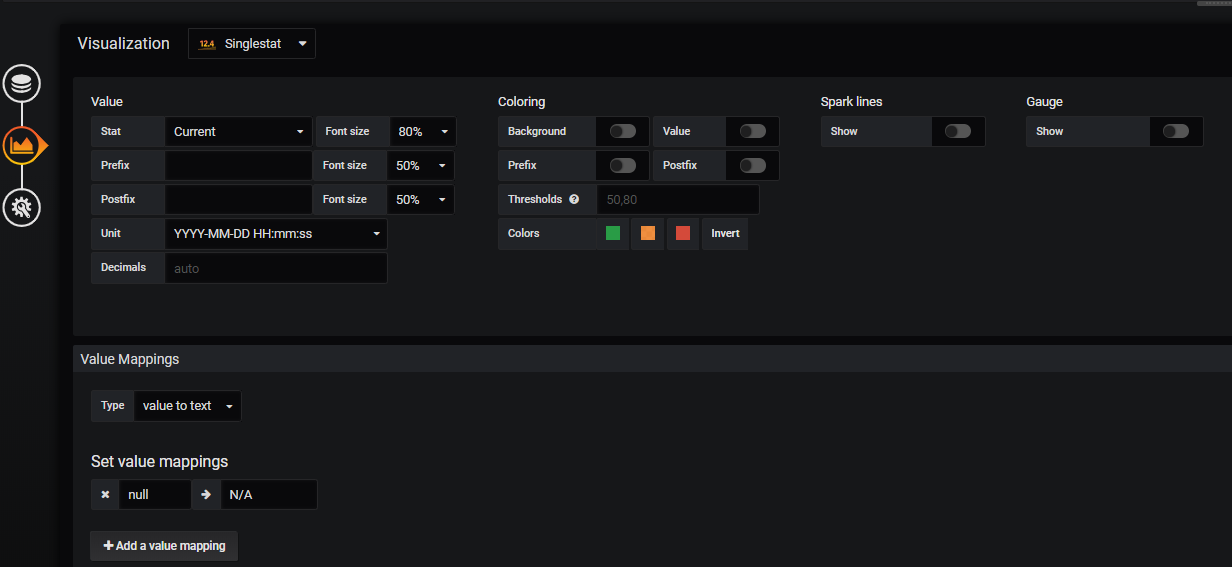
1) PostgreSQL Start Time
2) PostgreSQL Version
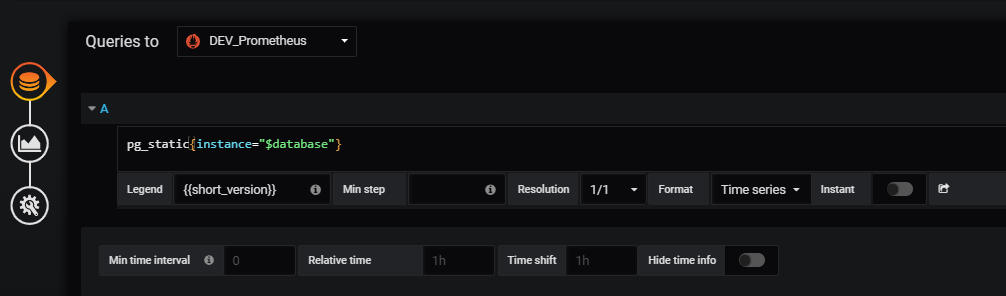
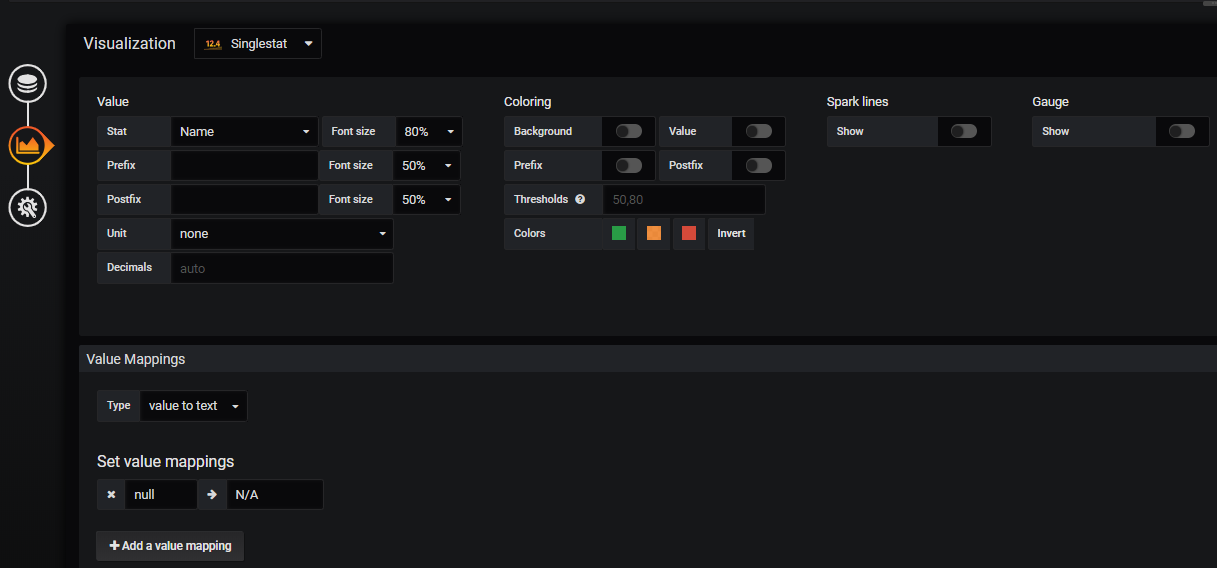
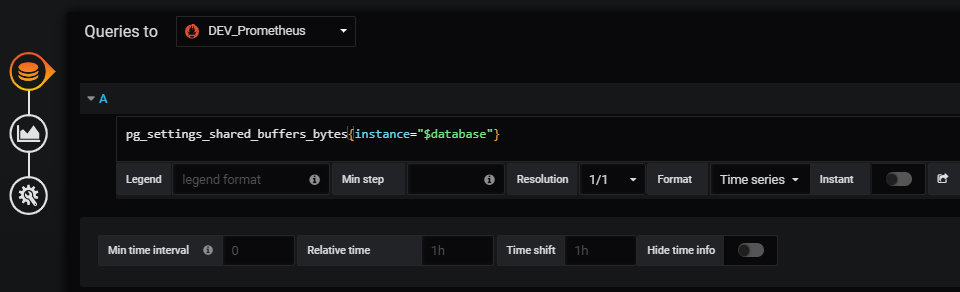
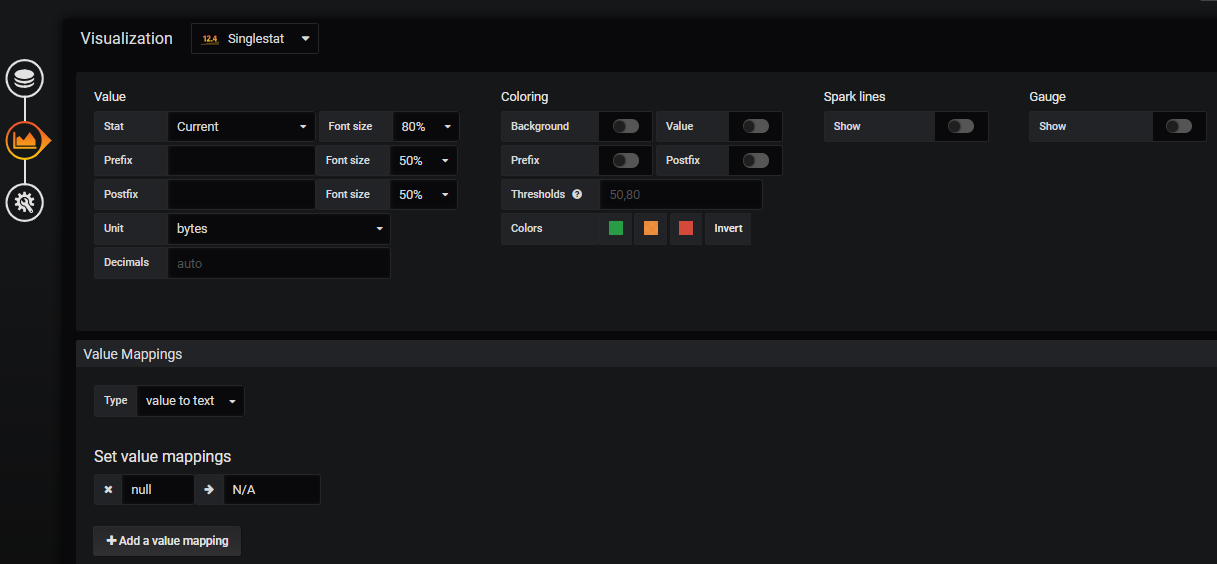
3) PostgreSQL Shared_buffers
4) PostgreSQL Effective_cache_size

5) PostgreSQL Work Memory


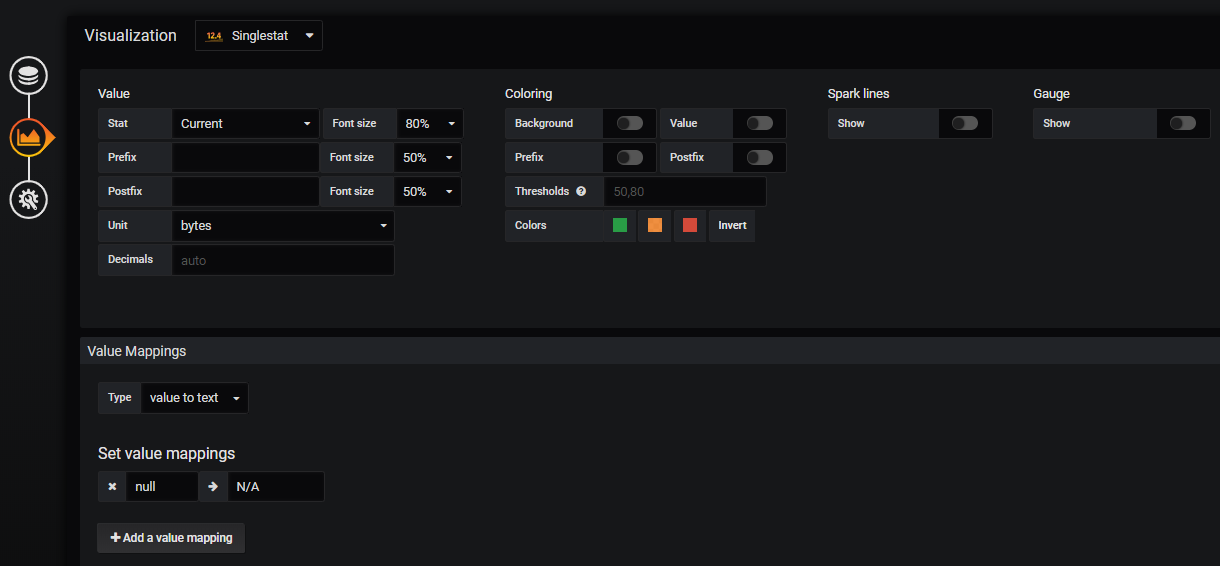
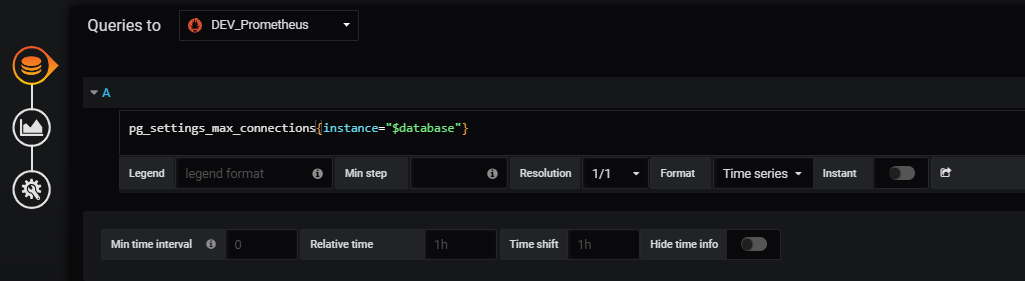
6) PostgreSQL Max Connections
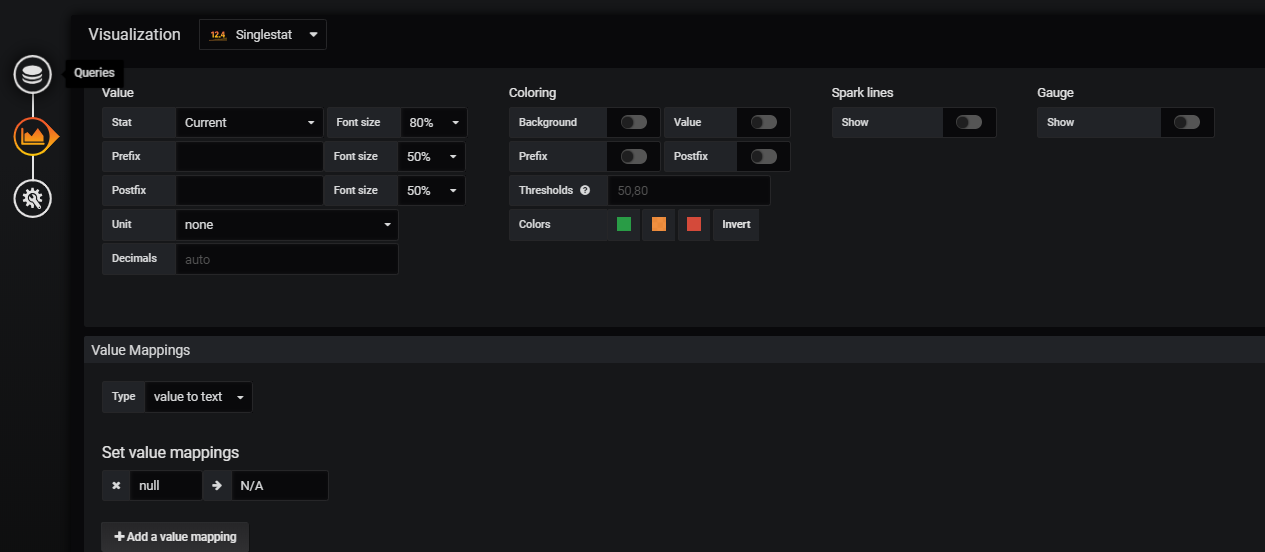
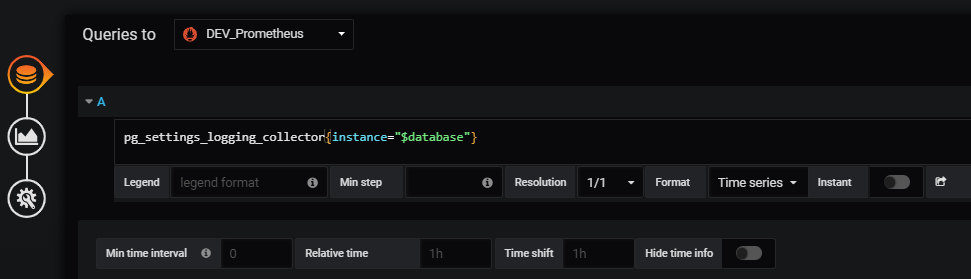
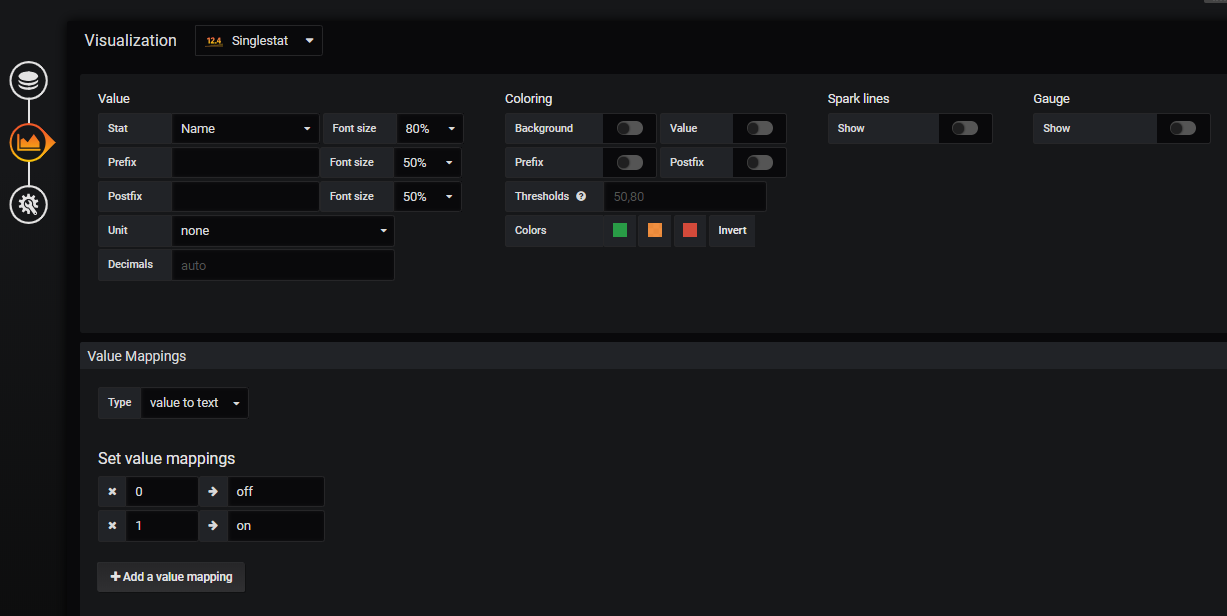
7) Logging Collector
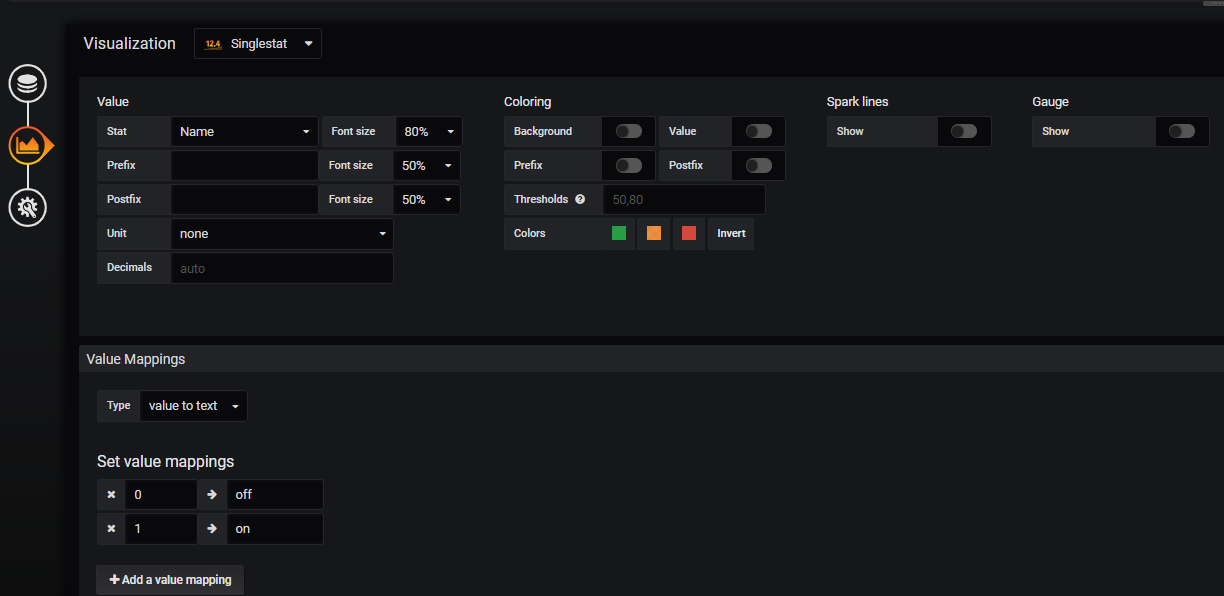
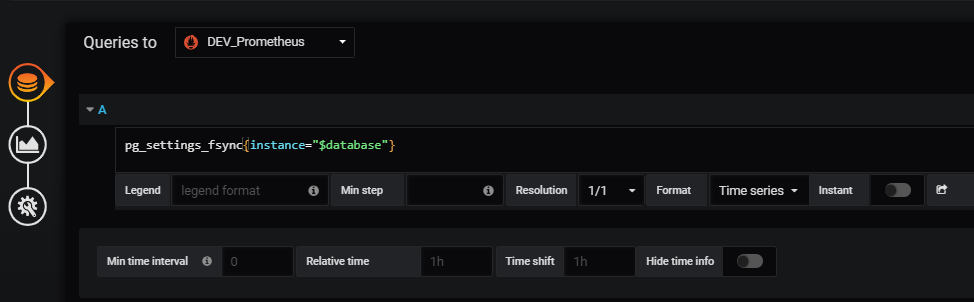
8) PostgreSQL Fsync
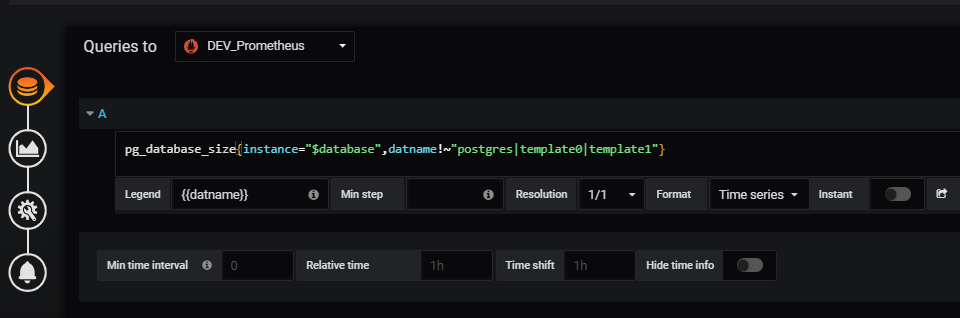
9) PostgreSQL Database Size
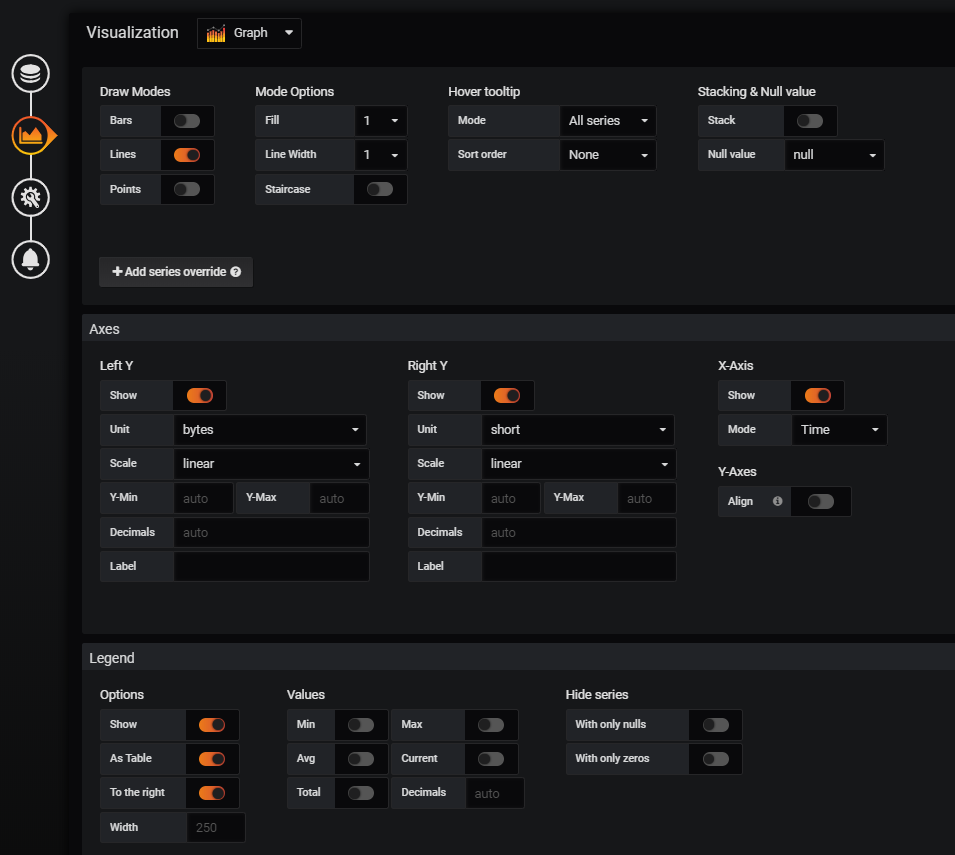
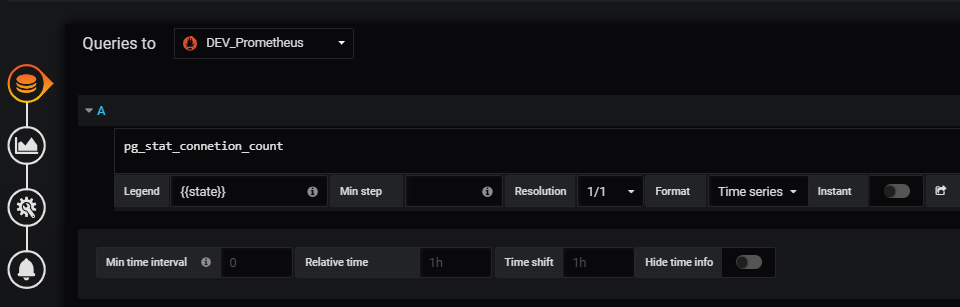
10) PostgreSQL Current Sessions
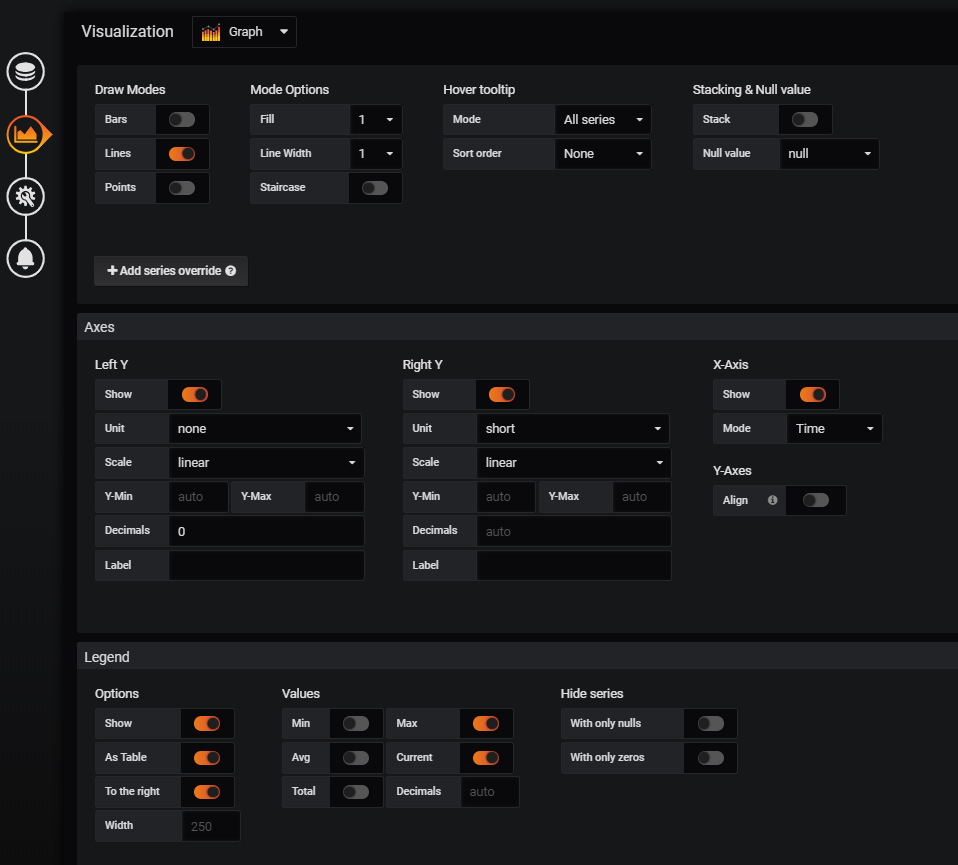
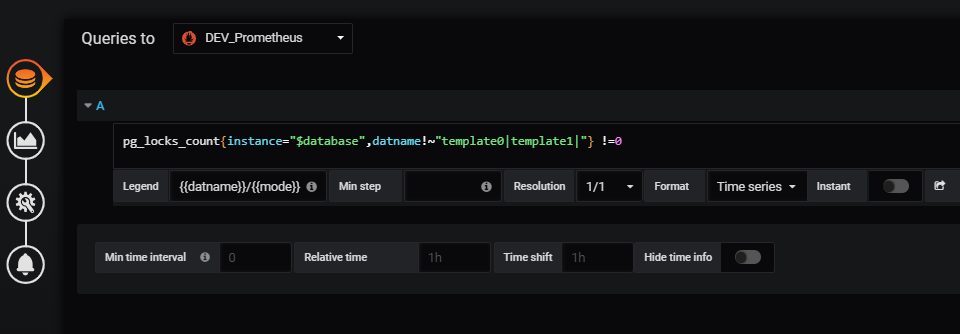
11) PostgreSQL Table Locks
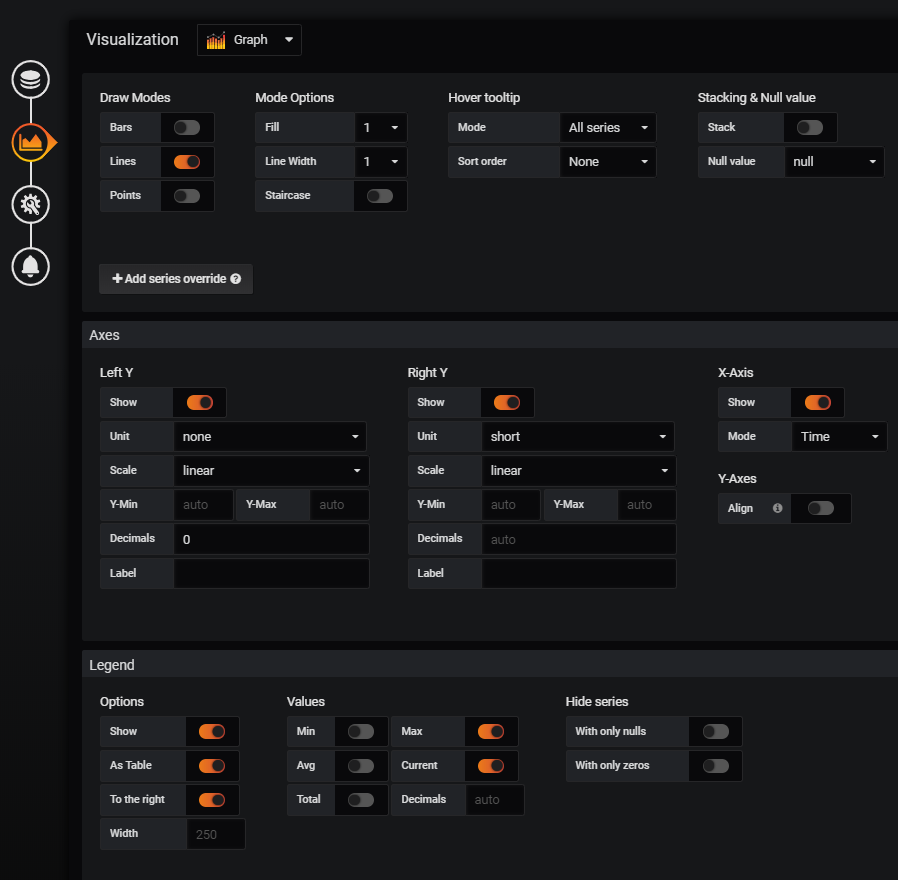
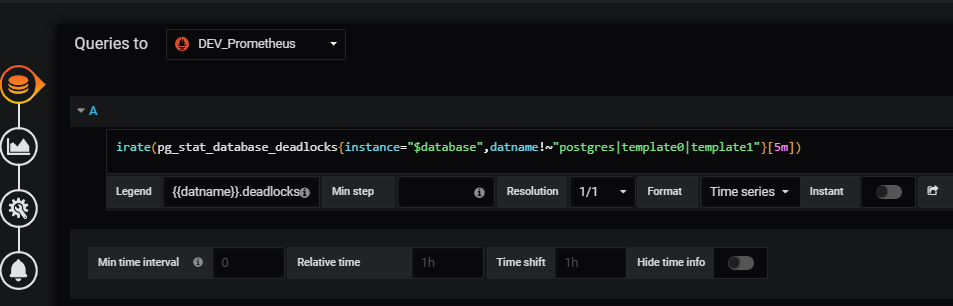
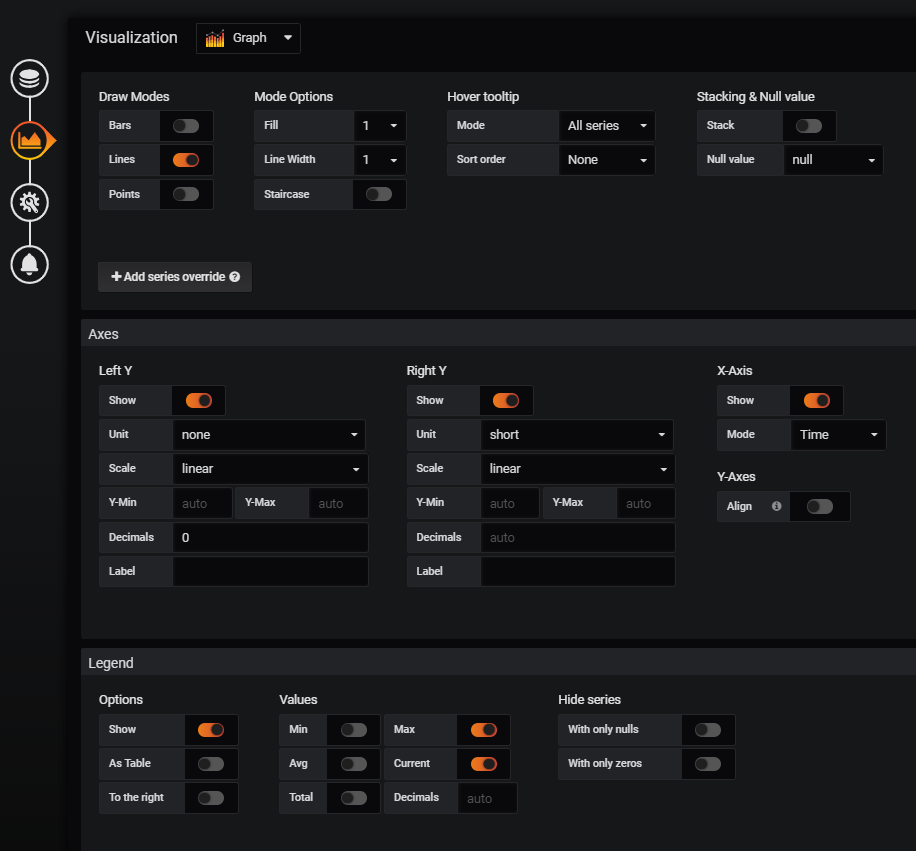
12) PostgreSQL Deadlocks
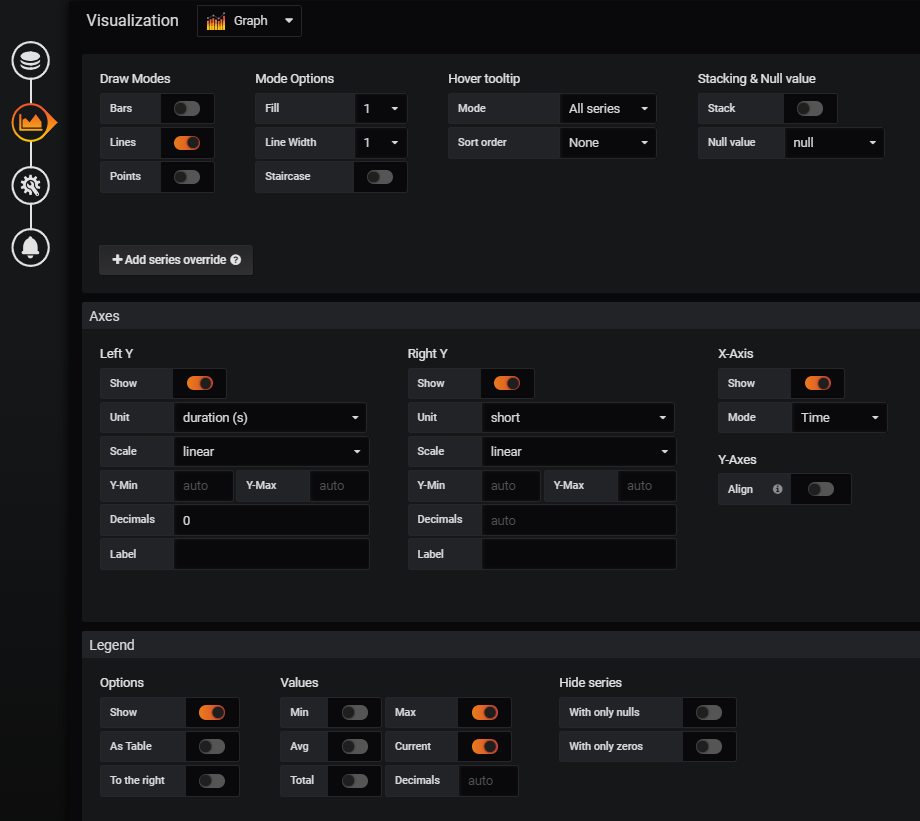
13) PostgreSQL Longest Transactions

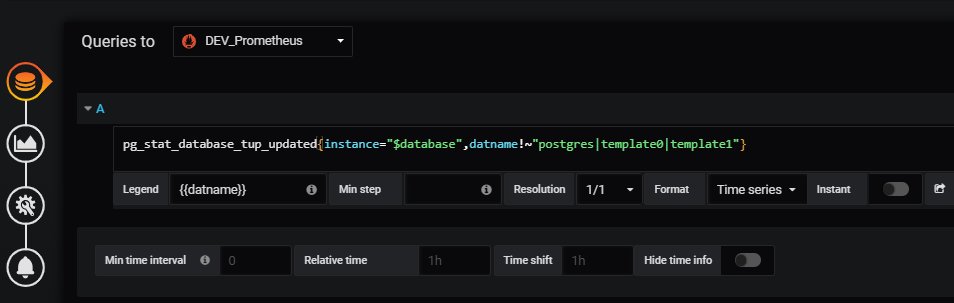
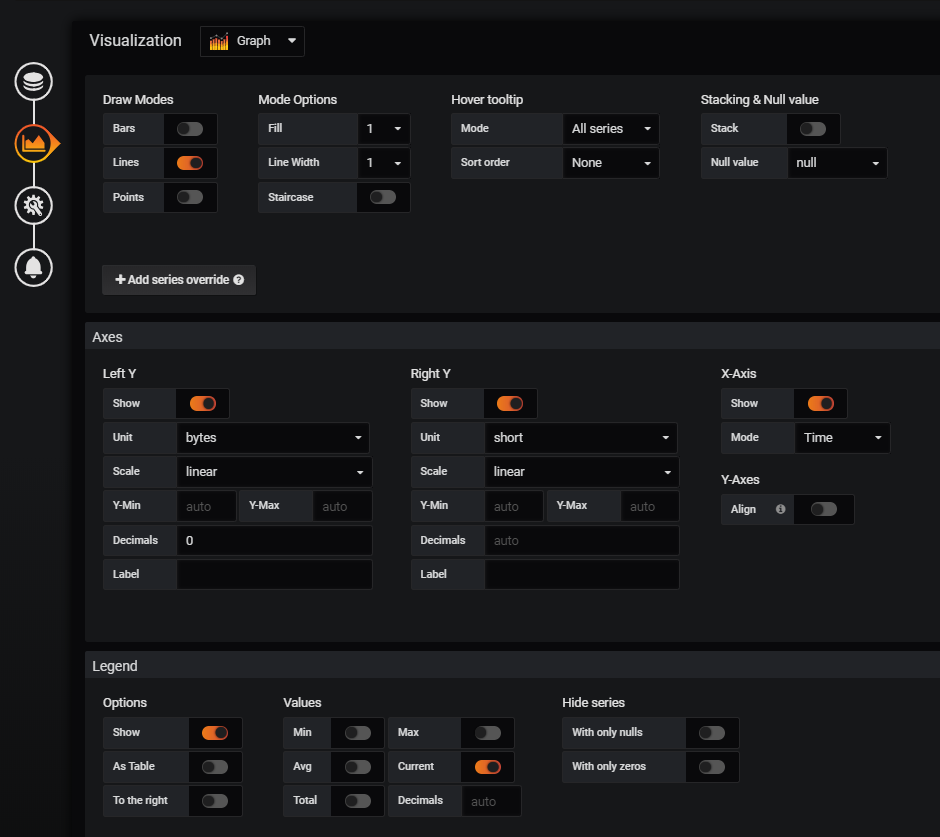
14) Tuple Updated
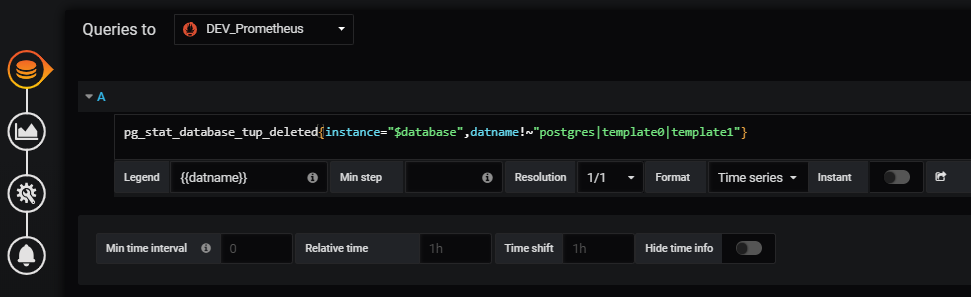
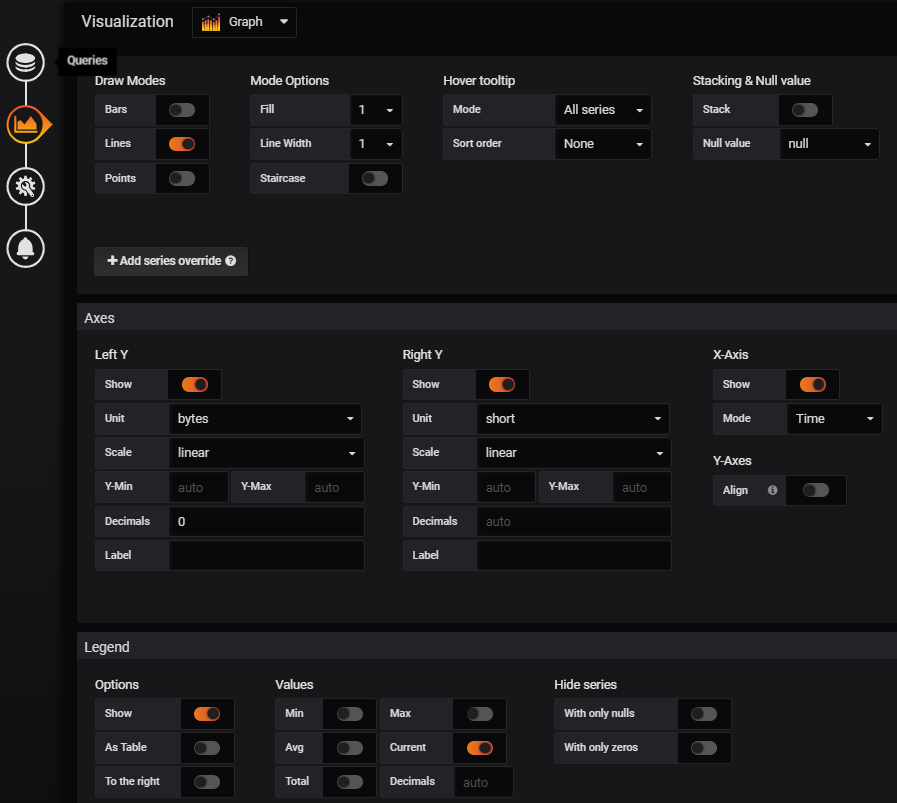
15) Tuple Deleted
16) Tuple Inserted

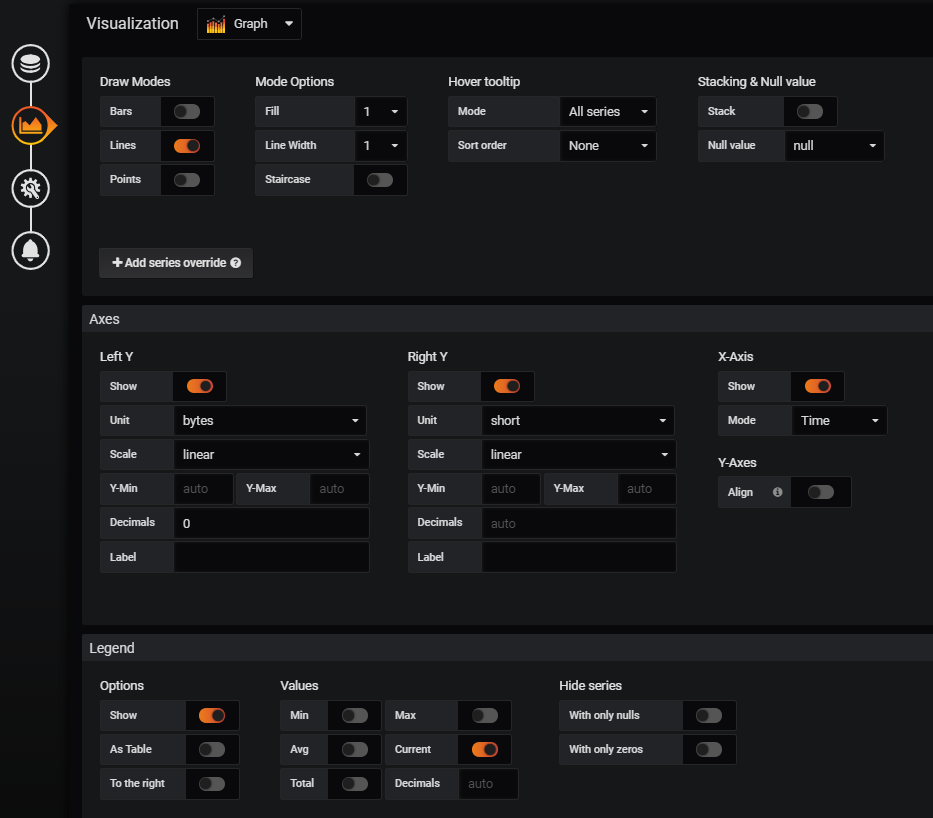
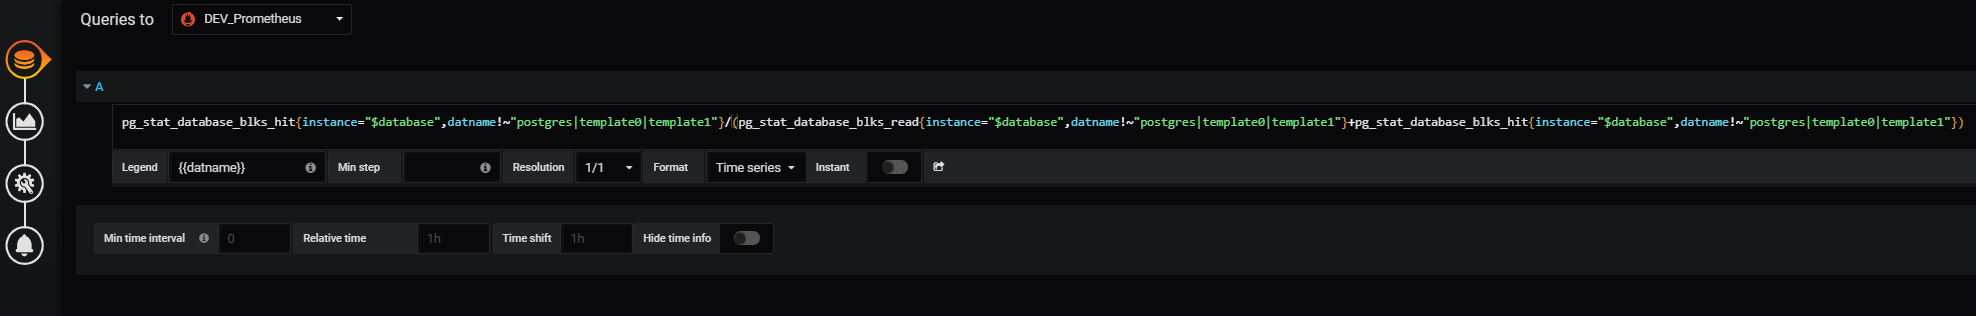
17) Cache Hit Rate
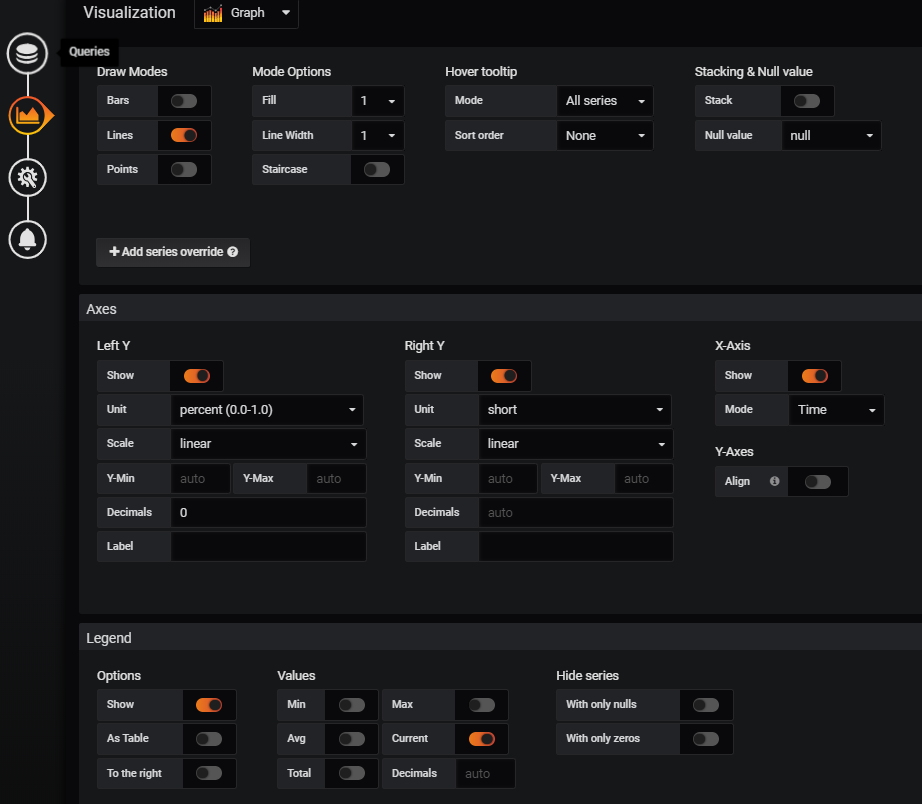
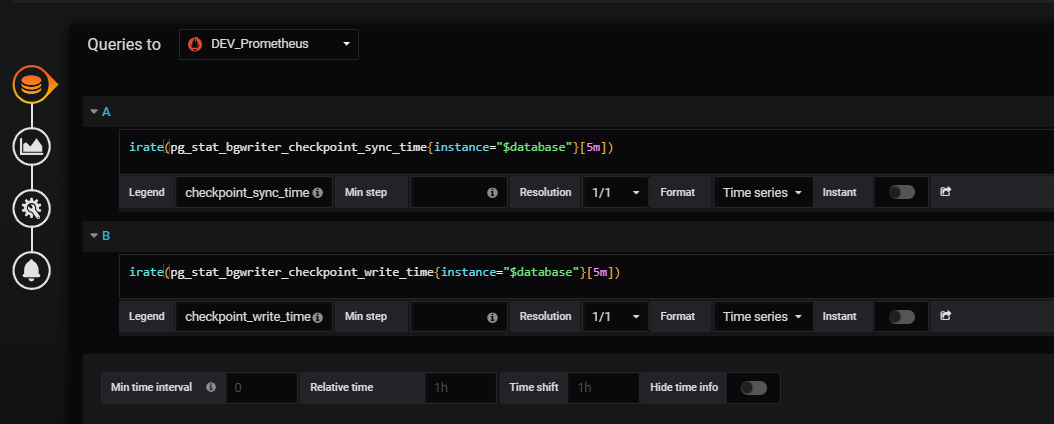
18) Checkpoint Stats

{ "__inputs": [ { "name": "DS_DEV_PROMETHEUS", "label": "DEV_Prometheus", "description": "", "type": "datasource", "pluginId": "prometheus", "pluginName": "Prometheus" } ], "__requires": [ { "type": "panel", "id": "gauge", "name": "Gauge", "version": "" }, { "type": "grafana", "id": "grafana", "name": "Grafana", "version": "6.0.1" }, { "type": "panel", "id": "graph", "name": "Graph", "version": "5.0.0" }, { "type": "datasource", "id": "prometheus", "name": "Prometheus", "version": "5.0.0" }, { "type": "panel", "id": "singlestat", "name": "Singlestat", "version": "5.0.0" }, { "type": "panel", "id": "table", "name": "Table", "version": "5.0.0" } ], "annotations": { "list": [ { "builtIn": 1, "datasource": "-- Grafana --", "enable": true, "hide": true, "iconColor": "rgba(0, 211, 255, 1)", "name": "Annotations & Alerts", "type": "dashboard" } ] }, "editable": true, "gnetId": null, "graphTooltip": 0, "id": null, "iteration": 1552826976555, "links": [], "panels": [ { "collapsed": false, "gridPos": { "h": 1, "w": 24, "x": 0, "y": 0 }, "id": 21, "panels": [], "title": "==============================System Summary==============================", "type": "row" }, { "cacheTimeout": null, "colorBackground": false, "colorValue": false, "colors": [ "#299c46", "rgba(237, 129, 40, 0.89)", "#d44a3a" ], "datasource": "${DS_DEV_PROMETHEUS}", "format": "dateTimeAsIso", "gauge": { "maxValue": 100, "minValue": 0, "show": false, "thresholdLabels": false, "thresholdMarkers": true }, "gridPos": { "h": 6, "w": 3, "x": 0, "y": 1 }, "id": 2, "interval": null, "links": [], "mappingType": 1, "mappingTypes": [ { "name": "value to text", "value": 1 }, { "name": "range to text", "value": 2 } ], "maxDataPoints": 100, "nullPointMode": "connected", "nullText": null, "postfix": "", "postfixFontSize": "50%", "prefix": "", "prefixFontSize": "50%", "rangeMaps": [ { "from": "null", "text": "N/A", "to": "null" } ], "sparkline": { "fillColor": "rgba(31, 118, 189, 0.18)", "full": false, "lineColor": "rgb(31, 120, 193)", "show": false }, "tableColumn": "", "targets": [ { "expr": "node_boot_time_seconds{instance="$server"} * 1000", "format": "time_series", "intervalFactor": 1, "legendFormat": "System Uptime(days)", "refId": "A" } ], "thresholds": "", "timeFrom": null, "timeShift": null, "title": "System Start Time", "type": "singlestat", "valueFontSize": "80%", "valueMaps": [ { "op": "=", "text": "N/A", "value": "null" } ], "valueName": "current" }, { "cacheTimeout": null, "colorBackground": false, "colorValue": false, "colors": [ "#299c46", "rgba(237, 129, 40, 0.89)", "#d44a3a" ], "datasource": "${DS_DEV_PROMETHEUS}", "format": "none", "gauge": { "maxValue": 100, "minValue": 0, "show": false, "thresholdLabels": false, "thresholdMarkers": true }, "gridPos": { "h": 3, "w": 2, "x": 3, "y": 1 }, "id": 4, "interval": null, "links": [], "mappingType": 1, "mappingTypes": [ { "name": "value to text", "value": 1 }, { "name": "range to text", "value": 2 } ], "maxDataPoints": 100, "nullPointMode": "connected", "nullText": null, "postfix": "", "postfixFontSize": "50%", "prefix": "", "prefixFontSize": "50%", "rangeMaps": [ { "from": "null", "text": "N/A", "to": "null" } ], "sparkline": { "fillColor": "rgba(31, 118, 189, 0.18)", "full": false, "lineColor": "rgb(31, 120, 193)", "show": false }, "tableColumn": "", "targets": [ { "expr": "count(count(node_cpu_seconds_total{instance="$server", mode='system'}) by (cpu))", "format": "time_series", "intervalFactor": 1, "refId": "A" } ], "thresholds": "", "timeFrom": null, "timeShift": null, "title": "CPU Cores", "type": "singlestat", "valueFontSize": "120%", "valueMaps": [ { "op": "=", "text": "N/A", "value": "null" } ], "valueName": "current" }, { "datasource": "${DS_DEV_PROMETHEUS}", "gridPos": { "h": 6, "w": 3, "x": 5, "y": 1 }, "id": 8, "links": [], "options": { "maxValue": 100, "minValue": 0, "showThresholdLabels": true, "showThresholdMarkers": true, "thresholds": [ { "color": "#7EB26D", "index": 0, "value": null }, { "color": "#FA6400", "index": 1, "value": 30 }, { "color": "#C4162A", "index": 2, "value": 70 } ], "valueMappings": [], "valueOptions": { "decimals": 2, "prefix": "", "stat": "current", "suffix": "", "unit": "percent" } }, "targets": [ { "expr": "100 - (avg(irate(node_cpu_seconds_total{instance="$server",mode="idle"}[5m])) * 100)", "format": "time_series", "intervalFactor": 1, "refId": "A" } ], "timeFrom": null, "timeShift": null, "title": "CPU Usage (5m)", "type": "gauge" }, { "datasource": "${DS_DEV_PROMETHEUS}", "gridPos": { "h": 6, "w": 3, "x": 8, "y": 1 }, "id": 10, "links": [], "options": { "maxValue": 100, "minValue": 0, "showThresholdLabels": true, "showThresholdMarkers": true, "thresholds": [ { "color": "#7EB26D", "index": 0, "value": null }, { "color": "#FA6400", "index": 1, "value": 30 }, { "color": "#C4162A", "index": 2, "value": 50 } ], "valueMappings": [], "valueOptions": { "decimals": 2, "prefix": "", "stat": "current", "suffix": "", "unit": "percent" } }, "targets": [ { "expr": "avg(irate(node_cpu_seconds_total{instance="$server",mode="iowait"}[5m])) * 100", "format": "time_series", "intervalFactor": 1, "refId": "A" } ], "timeFrom": null, "timeShift": null, "title": "CPU IO Wait (5m)", "type": "gauge" }, { "datasource": "${DS_DEV_PROMETHEUS}", "gridPos": { "h": 6, "w": 3, "x": 11, "y": 1 }, "id": 12, "links": [], "options": { "maxValue": 100, "minValue": 0, "showThresholdLabels": false, "showThresholdMarkers": true, "thresholds": [ { "color": "#7EB26D", "index": 0, "value": null }, { "color": "#FA6400", "index": 1, "value": 80 }, { "color": "#C4162A", "index": 2, "value": 90 } ], "valueMappings": [], "valueOptions": { "decimals": null, "prefix": "", "stat": "current", "suffix": "", "unit": "percent" } }, "targets": [ { "expr": "(node_memory_MemTotal_bytes{instance="$server"} - (node_memory_MemFree_bytes{instance="$server"} + node_memory_Buffers_bytes{instance="$server"} + node_memory_Cached_bytes{instance="$server"})) / node_memory_MemTotal_bytes{instance="$server"} * 100", "format": "time_series", "intervalFactor": 1, "refId": "A" } ], "timeFrom": null, "timeShift": null, "title": "Memory Used", "type": "gauge" }, { "datasource": "${DS_DEV_PROMETHEUS}", "gridPos": { "h": 6, "w": 3, "x": 14, "y": 1 }, "id": 13, "links": [], "options": { "maxValue": 100, "minValue": 0, "showThresholdLabels": false, "showThresholdMarkers": true, "thresholds": [ { "color": "#C4162A", "index": 0, "value": null }, { "color": "#FA6400", "index": 1, "value": 20 }, { "color": "#37872D", "index": 2, "value": 50 } ], "valueMappings": [], "valueOptions": { "decimals": 2, "prefix": "", "stat": "current", "suffix": "", "unit": "percent" } }, "targets": [ { "expr": "(node_memory_Cached_bytes{instance="$server"} * 100) / node_memory_MemTotal_bytes{instance="$server"}", "format": "time_series", "intervalFactor": 1, "refId": "A" } ], "timeFrom": null, "timeShift": null, "title": "Memory Cached", "type": "gauge" }, { "aliasColors": {}, "bars": false, "dashLength": 10, "dashes": false, "datasource": "${DS_DEV_PROMETHEUS}", "fill": 1, "gridPos": { "h": 6, "w": 7, "x": 17, "y": 1 }, "id": 15, "legend": { "alignAsTable": true, "avg": false, "current": true, "max": true, "min": false, "rightSide": true, "show": true, "total": false, "values": true }, "lines": true, "linewidth": 1, "links": [], "nullPointMode": "null", "paceLength": 10, "percentage": false, "pointradius": 2, "points": false, "renderer": "flot", "seriesOverrides": [], "stack": false, "steppedLine": false, "targets": [ { "expr": "node_load1{instance="$server"}", "format": "time_series", "intervalFactor": 1, "legendFormat": "1m", "refId": "A" }, { "expr": "node_load5{instance="$server"}", "format": "time_series", "intervalFactor": 1, "legendFormat": "5m", "refId": "B" }, { "expr": "node_load15{instance="$server"}", "format": "time_series", "intervalFactor": 1, "legendFormat": "15m", "refId": "C" } ], "thresholds": [], "timeFrom": null, "timeRegions": [], "timeShift": null, "title": "System Average Load (1,5,15) ", "tooltip": { "shared": true, "sort": 0, "value_type": "individual" }, "type": "graph", "xaxis": { "buckets": null, "mode": "time", "name": null, "show": true, "values": [] }, "yaxes": [ { "format": "short", "label": null, "logBase": 1, "max": null, "min": null, "show": true }, { "format": "short", "label": null, "logBase": 1, "max": null, "min": null, "show": true } ], "yaxis": { "align": false, "alignLevel": null } }, { "cacheTimeout": null, "colorBackground": false, "colorValue": false, "colors": [ "#299c46", "rgba(237, 129, 40, 0.89)", "#d44a3a" ], "datasource": "${DS_DEV_PROMETHEUS}", "format": "bytes", "gauge": { "maxValue": 100, "minValue": 0, "show": false, "thresholdLabels": false, "thresholdMarkers": true }, "gridPos": { "h": 3, "w": 2, "x": 3, "y": 4 }, "id": 6, "interval": null, "links": [], "mappingType": 1, "mappingTypes": [ { "name": "value to text", "value": 1 }, { "name": "range to text", "value": 2 } ], "maxDataPoints": 100, "nullPointMode": "connected", "nullText": null, "postfix": "", "postfixFontSize": "50%", "prefix": "", "prefixFontSize": "50%", "rangeMaps": [ { "from": "null", "text": "N/A", "to": "null" } ], "sparkline": { "fillColor": "rgba(31, 118, 189, 0.18)", "full": false, "lineColor": "rgb(31, 120, 193)", "show": false }, "tableColumn": "", "targets": [ { "expr": "node_memory_MemTotal_bytes{instance="$server"}", "format": "time_series", "intervalFactor": 1, "refId": "A" } ], "thresholds": "", "timeFrom": null, "timeShift": null, "title": "Memory Size", "type": "singlestat", "valueFontSize": "80%", "valueMaps": [ { "op": "=", "text": "N/A", "value": "null" } ], "valueName": "current" }, { "columns": [], "datasource": "${DS_DEV_PROMETHEUS}", "fontSize": "100%", "gridPos": { "h": 6, "w": 11, "x": 0, "y": 7 }, "id": 17, "links": [], "pageSize": null, "scroll": true, "showHeader": true, "sort": { "col": 9, "desc": false }, "styles": [ { "alias": "Available Size", "colorMode": "cell", "colors": [ "rgba(245, 54, 54, 0.9)", "rgba(237, 129, 40, 0.89)", "rgba(50, 172, 45, 0.97)" ], "decimals": 1, "link": false, "pattern": "Value #A", "thresholds": [ "1000000000", "5000000000" ], "type": "number", "unit": "bytes" }, { "alias": "Size Used Percent ", "colorMode": "cell", "colors": [ "rgba(50, 172, 45, 0.97)", "rgba(237, 129, 40, 0.89)", "rgba(245, 54, 54, 0.9)" ], "dateFormat": "YYYY-MM-DD HH:mm:ss", "decimals": 1, "mappingType": 1, "pattern": "Value #B", "thresholds": [ "0.8", "0.9" ], "type": "number", "unit": "percentunit" }, { "alias": "Total Size", "colorMode": null, "colors": [ "rgba(245, 54, 54, 0.9)", "rgba(237, 129, 40, 0.89)", "rgba(50, 172, 45, 0.97)" ], "dateFormat": "YYYY-MM-DD HH:mm:ss", "decimals": 0, "mappingType": 1, "pattern": "Value #C", "thresholds": [], "type": "number", "unit": "bytes" }, { "alias": "FIle System", "colorMode": null, "colors": [ "rgba(245, 54, 54, 0.9)", "rgba(237, 129, 40, 0.89)", "rgba(50, 172, 45, 0.97)" ], "dateFormat": "YYYY-MM-DD HH:mm:ss", "decimals": 2, "mappingType": 1, "pattern": "fstype", "thresholds": [], "type": "number", "unit": "short" }, { "alias": "Disk", "colorMode": null, "colors": [ "#37872D", "rgba(237, 129, 40, 0.89)", "rgba(50, 172, 45, 0.97)" ], "dateFormat": "YYYY-MM-DD HH:mm:ss", "decimals": 2, "mappingType": 1, "pattern": "device", "thresholds": [], "type": "number", "unit": "short" }, { "alias": "Mount Point", "colorMode": null, "colors": [ "rgba(245, 54, 54, 0.9)", "rgba(237, 129, 40, 0.89)", "rgba(50, 172, 45, 0.97)" ], "dateFormat": "YYYY-MM-DD HH:mm:ss", "decimals": 2, "mappingType": 1, "pattern": "mountpoint", "thresholds": [], "type": "number", "unit": "short" }, { "alias": "", "colorMode": null, "colors": [ "rgba(245, 54, 54, 0.9)", "rgba(237, 129, 40, 0.89)", "rgba(50, 172, 45, 0.97)" ], "dateFormat": "YYYY-MM-DD HH:mm:ss", "decimals": 2, "mappingType": 1, "pattern": "/.*/", "thresholds": [], "type": "hidden", "unit": "short" } ], "targets": [ { "expr": "(node_filesystem_size_bytes{instance='$server',fstype=~"ext3|ext4|xfs|nfs"})/100 *100", "format": "table", "instant": true, "intervalFactor": 1, "refId": "C" }, { "expr": "node_filesystem_avail_bytes {instance='$server',fstype=~"ext3|ext4|xfs|nfs"}", "format": "table", "instant": true, "intervalFactor": 1, "refId": "A" }, { "expr": "1-(node_filesystem_free_bytes{instance='$server',fstype=~"ext3|ext4|xfs|nfs"} / node_filesystem_size_bytes{instance='$server',fstype=~"ext3|ext4|xfs|nfs"})", "format": "table", "instant": true, "intervalFactor": 1, "refId": "B" } ], "timeFrom": null, "timeShift": null, "title": "Disk Usage", "transform": "table", "type": "table" }, { "aliasColors": {}, "bars": false, "dashLength": 10, "dashes": false, "datasource": "${DS_DEV_PROMETHEUS}", "fill": 1, "gridPos": { "h": 6, "w": 13, "x": 11, "y": 7 }, "id": 19, "legend": { "avg": false, "current": true, "max": false, "min": false, "show": true, "total": false, "values": true }, "lines": true, "linewidth": 1, "links": [], "nullPointMode": "null", "paceLength": 10, "percentage": false, "pointradius": 2, "points": false, "renderer": "flot", "seriesOverrides": [ { "alias": "/.*writes$/", "transform": "negative-Y" } ], "stack": false, "steppedLine": false, "targets": [ { "expr": "irate(node_disk_reads_completed_total{instance=~"$server"}[1m])", "format": "time_series", "intervalFactor": 1, "legendFormat": "{{device}}_reads", "refId": "A" }, { "expr": "irate(node_disk_writes_completed_total{instance=~"$server"}[1m])", "format": "time_series", "intervalFactor": 1, "legendFormat": "{{device}}_writes", "refId": "B" }, { "expr": "node_disk_io_now{instance=~"$server"}", "format": "time_series", "intervalFactor": 1, "legendFormat": "{{device}}", "refId": "C" } ], "thresholds": [], "timeFrom": null, "timeRegions": [], "timeShift": null, "title": "Disk Read/Write IOPS (1m)", "tooltip": { "shared": true, "sort": 0, "value_type": "individual" }, "type": "graph", "xaxis": { "buckets": null, "mode": "time", "name": null, "show": true, "values": [] }, "yaxes": [ { "format": "ops", "label": "reads(+)/ writes(-) ", "logBase": 1, "max": null, "min": null, "show": true }, { "format": "short", "label": "I/O ops/sec", "logBase": 1, "max": null, "min": null, "show": true } ], "yaxis": { "align": false, "alignLevel": null } }, { "collapsed": true, "gridPos": { "h": 1, "w": 24, "x": 0, "y": 13 }, "id": 23, "panels": [], "title": "==============================Databsase Summary==============================", "type": "row" }, { "cacheTimeout": null, "colorBackground": false, "colorValue": false, "colors": [ "#299c46", "rgba(237, 129, 40, 0.89)", "#d44a3a" ], "datasource": "${DS_DEV_PROMETHEUS}", "format": "dateTimeAsIso", "gauge": { "maxValue": 100, "minValue": 0, "show": false, "thresholdLabels": false, "thresholdMarkers": true }, "gridPos": { "h": 4, "w": 4, "x": 0, "y": 14 }, "id": 25, "interval": null, "links": [], "mappingType": 1, "mappingTypes": [ { "name": "value to text", "value": 1 }, { "name": "range to text", "value": 2 } ], "maxDataPoints": 100, "nullPointMode": "connected", "nullText": null, "postfix": "", "postfixFontSize": "50%", "prefix": "", "prefixFontSize": "50%", "rangeMaps": [ { "from": "null", "text": "N/A", "to": "null" } ], "sparkline": { "fillColor": "rgba(31, 118, 189, 0.18)", "full": false, "lineColor": "rgb(31, 120, 193)", "show": false }, "tableColumn": "", "targets": [ { "expr": "pg_postmaster_start_time_seconds{instance="$database"} * 1000", "format": "time_series", "intervalFactor": 1, "refId": "A" } ], "thresholds": "", "timeFrom": null, "timeShift": null, "title": "PostgreSQL Start Time", "type": "singlestat", "valueFontSize": "80%", "valueMaps": [ { "op": "=", "text": "N/A", "value": "null" } ], "valueName": "current" }, { "cacheTimeout": null, "colorBackground": false, "colorValue": false, "colors": [ "#299c46", "rgba(237, 129, 40, 0.89)", "#d44a3a" ], "datasource": "${DS_DEV_PROMETHEUS}", "format": "none", "gauge": { "maxValue": 100, "minValue": 0, "show": false, "thresholdLabels": false, "thresholdMarkers": true }, "gridPos": { "h": 4, "w": 3, "x": 4, "y": 14 }, "id": 26, "interval": null, "links": [], "mappingType": 1, "mappingTypes": [ { "name": "value to text", "value": 1 }, { "name": "range to text", "value": 2 } ], "maxDataPoints": 100, "nullPointMode": "connected", "nullText": null, "postfix": "", "postfixFontSize": "50%", "prefix": "", "prefixFontSize": "50%", "rangeMaps": [ { "from": "null", "text": "N/A", "to": "null" } ], "sparkline": { "fillColor": "rgba(31, 118, 189, 0.18)", "full": false, "lineColor": "rgb(31, 120, 193)", "show": false }, "tableColumn": "", "targets": [ { "expr": "pg_static{instance="$database"}", "format": "time_series", "intervalFactor": 1, "legendFormat": "{{short_version}}", "refId": "A" } ], "thresholds": "", "timeFrom": null, "timeShift": null, "title": "PostgreSQL Version", "type": "singlestat", "valueFontSize": "80%", "valueMaps": [ { "op": "=", "text": "N/A", "value": "null" } ], "valueName": "name" }, { "cacheTimeout": null, "colorBackground": false, "colorValue": false, "colors": [ "#299c46", "rgba(237, 129, 40, 0.89)", "#d44a3a" ], "datasource": "${DS_DEV_PROMETHEUS}", "format": "bytes", "gauge": { "maxValue": 100, "minValue": 0, "show": false, "thresholdLabels": false, "thresholdMarkers": true }, "gridPos": { "h": 4, "w": 3, "x": 7, "y": 14 }, "id": 27, "interval": null, "links": [], "mappingType": 1, "mappingTypes": [ { "name": "value to text", "value": 1 }, { "name": "range to text", "value": 2 } ], "maxDataPoints": 100, "nullPointMode": "connected", "nullText": null, "postfix": "", "postfixFontSize": "50%", "prefix": "", "prefixFontSize": "50%", "rangeMaps": [ { "from": "null", "text": "N/A", "to": "null" } ], "sparkline": { "fillColor": "rgba(31, 118, 189, 0.18)", "full": false, "lineColor": "rgb(31, 120, 193)", "show": false }, "tableColumn": "", "targets": [ { "expr": "pg_settings_shared_buffers_bytes{instance="$database"}", "format": "time_series", "intervalFactor": 1, "legendFormat": "", "refId": "A" } ], "thresholds": "", "timeFrom": null, "timeShift": null, "title": "PostgreSQL Shared_buffers", "type": "singlestat", "valueFontSize": "80%", "valueMaps": [ { "op": "=", "text": "N/A", "value": "null" } ], "valueName": "current" }, { "cacheTimeout": null, "colorBackground": false, "colorValue": false, "colors": [ "#299c46", "rgba(237, 129, 40, 0.89)", "#d44a3a" ], "datasource": "${DS_DEV_PROMETHEUS}", "format": "bytes", "gauge": { "maxValue": 100, "minValue": 0, "show": false, "thresholdLabels": false, "thresholdMarkers": true }, "gridPos": { "h": 4, "w": 3, "x": 10, "y": 14 }, "id": 28, "interval": null, "links": [], "mappingType": 1, "mappingTypes": [ { "name": "value to text", "value": 1 }, { "name": "range to text", "value": 2 } ], "maxDataPoints": 100, "nullPointMode": "connected", "nullText": null, "postfix": "", "postfixFontSize": "50%", "prefix": "", "prefixFontSize": "50%", "rangeMaps": [ { "from": "null", "text": "N/A", "to": "null" } ], "sparkline": { "fillColor": "rgba(31, 118, 189, 0.18)", "full": false, "lineColor": "rgb(31, 120, 193)", "show": false }, "tableColumn": "", "targets": [ { "expr": "pg_settings_effective_cache_size_bytes{instance="$database"}", "format": "time_series", "intervalFactor": 1, "legendFormat": "", "refId": "A" } ], "thresholds": "", "timeFrom": null, "timeShift": null, "title": "PostgreSQL Effective_cache_size", "type": "singlestat", "valueFontSize": "80%", "valueMaps": [ { "op": "=", "text": "N/A", "value": "null" } ], "valueName": "current" }, { "cacheTimeout": null, "colorBackground": false, "colorValue": false, "colors": [ "#299c46", "rgba(237, 129, 40, 0.89)", "#d44a3a" ], "datasource": "${DS_DEV_PROMETHEUS}", "format": "bytes", "gauge": { "maxValue": 100, "minValue": 0, "show": false, "thresholdLabels": false, "thresholdMarkers": true }, "gridPos": { "h": 4, "w": 3, "x": 13, "y": 14 }, "id": 29, "interval": null, "links": [], "mappingType": 1, "mappingTypes": [ { "name": "value to text", "value": 1 }, { "name": "range to text", "value": 2 } ], "maxDataPoints": 100, "nullPointMode": "connected", "nullText": null, "postfix": "", "postfixFontSize": "50%", "prefix": "", "prefixFontSize": "50%", "rangeMaps": [ { "from": "null", "text": "N/A", "to": "null" } ], "sparkline": { "fillColor": "rgba(31, 118, 189, 0.18)", "full": false, "lineColor": "rgb(31, 120, 193)", "show": false }, "tableColumn": "", "targets": [ { "expr": "pg_settings_work_mem_bytes{instance="$database"}", "format": "time_series", "intervalFactor": 1, "legendFormat": "", "refId": "A" } ], "thresholds": "", "timeFrom": null, "timeShift": null, "title": "PostgreSQL Work Memory", "type": "singlestat", "valueFontSize": "80%", "valueMaps": [ { "op": "=", "text": "N/A", "value": "null" } ], "valueName": "current" }, { "cacheTimeout": null, "colorBackground": false, "colorValue": false, "colors": [ "#299c46", "rgba(237, 129, 40, 0.89)", "#d44a3a" ], "datasource": "${DS_DEV_PROMETHEUS}", "format": "none", "gauge": { "maxValue": 100, "minValue": 0, "show": false, "thresholdLabels": false, "thresholdMarkers": true }, "gridPos": { "h": 4, "w": 3, "x": 16, "y": 14 }, "id": 30, "interval": null, "links": [], "mappingType": 1, "mappingTypes": [ { "name": "value to text", "value": 1 }, { "name": "range to text", "value": 2 } ], "maxDataPoints": 100, "nullPointMode": "connected", "nullText": null, "postfix": "", "postfixFontSize": "50%", "prefix": "", "prefixFontSize": "50%", "rangeMaps": [ { "from": "null", "text": "N/A", "to": "null" } ], "sparkline": { "fillColor": "rgba(31, 118, 189, 0.18)", "full": false, "lineColor": "rgb(31, 120, 193)", "show": false }, "tableColumn": "", "targets": [ { "expr": "pg_settings_max_connections{instance="$database"}", "format": "time_series", "intervalFactor": 1, "legendFormat": "", "refId": "A" } ], "thresholds": "", "timeFrom": null, "timeShift": null, "title": "PostgreSQL Max Connections", "type": "singlestat", "valueFontSize": "80%", "valueMaps": [ { "op": "=", "text": "N/A", "value": "null" } ], "valueName": "current" }, { "cacheTimeout": null, "colorBackground": false, "colorValue": false, "colors": [ "#299c46", "rgba(237, 129, 40, 0.89)", "#d44a3a" ], "datasource": "${DS_DEV_PROMETHEUS}", "format": "none", "gauge": { "maxValue": 100, "minValue": 0, "show": false, "thresholdLabels": false, "thresholdMarkers": true }, "gridPos": { "h": 4, "w": 3, "x": 19, "y": 14 }, "id": 31, "interval": null, "links": [], "mappingType": 1, "mappingTypes": [ { "name": "value to text", "value": 1 }, { "name": "range to text", "value": 2 } ], "maxDataPoints": 100, "nullPointMode": "connected", "nullText": null, "postfix": "", "postfixFontSize": "50%", "prefix": "", "prefixFontSize": "50%", "rangeMaps": [ { "from": "null", "text": "N/A", "to": "null" } ], "sparkline": { "fillColor": "rgba(31, 118, 189, 0.18)", "full": false, "lineColor": "rgb(31, 120, 193)", "show": false }, "tableColumn": "", "targets": [ { "expr": "pg_settings_logging_collector{instance="$database"}", "format": "time_series", "intervalFactor": 1, "legendFormat": "", "refId": "A" } ], "thresholds": "", "timeFrom": null, "timeShift": null, "title": "Logging Collector", "type": "singlestat", "valueFontSize": "80%", "valueMaps": [ { "op": "=", "text": "off", "value": "0" }, { "op": "=", "text": "on", "value": "1" } ], "valueName": "current" }, { "cacheTimeout": null, "colorBackground": false, "colorValue": false, "colors": [ "#299c46", "rgba(237, 129, 40, 0.89)", "#d44a3a" ], "datasource": "${DS_DEV_PROMETHEUS}", "format": "none", "gauge": { "maxValue": 100, "minValue": 0, "show": false, "thresholdLabels": false, "thresholdMarkers": true }, "gridPos": { "h": 4, "w": 2, "x": 22, "y": 14 }, "id": 32, "interval": null, "links": [], "mappingType": 1, "mappingTypes": [ { "name": "value to text", "value": 1 }, { "name": "range to text", "value": 2 } ], "maxDataPoints": 100, "nullPointMode": "connected", "nullText": null, "postfix": "", "postfixFontSize": "50%", "prefix": "", "prefixFontSize": "50%", "rangeMaps": [ { "from": "null", "text": "N/A", "to": "null" } ], "sparkline": { "fillColor": "rgba(31, 118, 189, 0.18)", "full": false, "lineColor": "rgb(31, 120, 193)", "show": false }, "tableColumn": "", "targets": [ { "expr": "pg_settings_fsync{instance="$database"}", "format": "time_series", "intervalFactor": 1, "legendFormat": "", "refId": "A" } ], "thresholds": "", "timeFrom": null, "timeShift": null, "title": "PostgreSQL Fsync", "type": "singlestat", "valueFontSize": "80%", "valueMaps": [ { "op": "=", "text": "off", "value": "0" }, { "op": "=", "text": "on", "value": "1" } ], "valueName": "current" }, { "aliasColors": {}, "bars": false, "dashLength": 10, "dashes": false, "datasource": "${DS_DEV_PROMETHEUS}", "fill": 1, "gridPos": { "h": 7, "w": 5, "x": 0, "y": 18 }, "id": 34, "legend": { "alignAsTable": false, "avg": false, "current": false, "max": false, "min": false, "rightSide": false, "show": true, "total": false, "values": false }, "lines": true, "linewidth": 1, "links": [], "nullPointMode": "null", "paceLength": 10, "percentage": false, "pointradius": 2, "points": false, "renderer": "flot", "seriesOverrides": [], "stack": false, "steppedLine": false, "targets": [ { "expr": "pg_database_size{instance="$database",datname!~"postgres|template0|template1"}", "format": "time_series", "intervalFactor": 1, "legendFormat": "{{datname}}", "refId": "A" } ], "thresholds": [], "timeFrom": null, "timeRegions": [], "timeShift": null, "title": "PostgreSQL Database Size", "tooltip": { "shared": true, "sort": 0, "value_type": "individual" }, "type": "graph", "xaxis": { "buckets": null, "mode": "time", "name": null, "show": true, "values": [] }, "yaxes": [ { "format": "bytes", "label": null, "logBase": 1, "max": null, "min": null, "show": true }, { "format": "short", "label": null, "logBase": 1, "max": null, "min": null, "show": true } ], "yaxis": { "align": false, "alignLevel": null } }, { "aliasColors": {}, "bars": false, "dashLength": 10, "dashes": false, "datasource": "${DS_DEV_PROMETHEUS}", "decimals": null, "fill": 1, "gridPos": { "h": 7, "w": 7, "x": 5, "y": 18 }, "id": 36, "legend": { "alignAsTable": false, "avg": false, "current": true, "hideEmpty": false, "max": true, "min": false, "rightSide": false, "show": true, "total": false, "values": true }, "lines": true, "linewidth": 1, "links": [], "nullPointMode": "null", "paceLength": 10, "percentage": false, "pointradius": 2, "points": false, "renderer": "flot", "seriesOverrides": [], "stack": false, "steppedLine": false, "targets": [ { "expr": "pg_stat_connetion_count", "format": "time_series", "intervalFactor": 1, "legendFormat": "{{state}}", "refId": "A" } ], "thresholds": [], "timeFrom": null, "timeRegions": [], "timeShift": null, "title": "PostgreSQL Current Sessions", "tooltip": { "shared": true, "sort": 0, "value_type": "individual" }, "type": "graph", "xaxis": { "buckets": null, "mode": "time", "name": null, "show": true, "values": [] }, "yaxes": [ { "decimals": 0, "format": "none", "label": null, "logBase": 1, "max": null, "min": null, "show": true }, { "format": "short", "label": null, "logBase": 1, "max": null, "min": null, "show": true } ], "yaxis": { "align": false, "alignLevel": null } }, { "aliasColors": {}, "bars": false, "dashLength": 10, "dashes": false, "datasource": "${DS_DEV_PROMETHEUS}", "decimals": null, "fill": 1, "gridPos": { "h": 7, "w": 6, "x": 12, "y": 18 }, "id": 37, "legend": { "alignAsTable": false, "avg": false, "current": true, "hideEmpty": false, "max": true, "min": false, "rightSide": false, "show": true, "total": false, "values": true }, "lines": true, "linewidth": 1, "links": [], "nullPointMode": "null", "paceLength": 10, "percentage": false, "pointradius": 2, "points": false, "renderer": "flot", "seriesOverrides": [], "stack": false, "steppedLine": false, "targets": [ { "expr": "pg_locks_count{instance="$database",datname!~"template0|template1|"} !=0", "format": "time_series", "intervalFactor": 1, "legendFormat": "{{datname}}/{{mode}}", "refId": "A" } ], "thresholds": [], "timeFrom": null, "timeRegions": [], "timeShift": null, "title": "PostgreSQL Table Locks", "tooltip": { "shared": true, "sort": 0, "value_type": "individual" }, "type": "graph", "xaxis": { "buckets": null, "mode": "time", "name": null, "show": true, "values": [] }, "yaxes": [ { "decimals": 0, "format": "none", "label": null, "logBase": 1, "max": null, "min": null, "show": true }, { "format": "short", "label": null, "logBase": 1, "max": null, "min": null, "show": true } ], "yaxis": { "align": false, "alignLevel": null } }, { "aliasColors": {}, "bars": false, "dashLength": 10, "dashes": false, "datasource": "${DS_DEV_PROMETHEUS}", "decimals": null, "fill": 1, "gridPos": { "h": 7, "w": 6, "x": 18, "y": 18 }, "id": 38, "legend": { "alignAsTable": false, "avg": false, "current": true, "hideEmpty": false, "max": true, "min": false, "rightSide": false, "show": true, "total": false, "values": true }, "lines": true, "linewidth": 1, "links": [], "nullPointMode": "null", "paceLength": 10, "percentage": false, "pointradius": 2, "points": false, "renderer": "flot", "seriesOverrides": [], "stack": false, "steppedLine": false, "targets": [ { "expr": "irate(pg_stat_database_deadlocks{instance="$database",datname!~"postgres|template0|template1"}[5m])", "format": "time_series", "intervalFactor": 1, "legendFormat": "{{datname}}.deadlocks", "refId": "A" } ], "thresholds": [], "timeFrom": null, "timeRegions": [], "timeShift": null, "title": "PostgreSQL Deadlocks", "tooltip": { "shared": true, "sort": 0, "value_type": "individual" }, "type": "graph", "xaxis": { "buckets": null, "mode": "time", "name": null, "show": true, "values": [] }, "yaxes": [ { "decimals": 0, "format": "none", "label": null, "logBase": 1, "max": null, "min": null, "show": true }, { "format": "short", "label": null, "logBase": 1, "max": null, "min": null, "show": true } ], "yaxis": { "align": false, "alignLevel": null } }, { "aliasColors": {}, "bars": false, "dashLength": 10, "dashes": false, "datasource": "${DS_DEV_PROMETHEUS}", "decimals": null, "fill": 1, "gridPos": { "h": 7, "w": 6, "x": 0, "y": 25 }, "id": 39, "legend": { "alignAsTable": false, "avg": false, "current": true, "hideEmpty": false, "max": false, "min": false, "rightSide": false, "show": true, "total": false, "values": true }, "lines": true, "linewidth": 1, "links": [], "nullPointMode": "null", "paceLength": 10, "percentage": false, "pointradius": 2, "points": false, "renderer": "flot", "seriesOverrides": [], "stack": false, "steppedLine": false, "targets": [ { "expr": "pg_stat_long_runtime{instance="$database"}", "format": "time_series", "intervalFactor": 1, "legendFormat": "PID: {{pid}}", "refId": "A" } ], "thresholds": [], "timeFrom": null, "timeRegions": [], "timeShift": null, "title": "PostgreSQL Deadlocks", "tooltip": { "shared": true, "sort": 0, "value_type": "individual" }, "type": "graph", "xaxis": { "buckets": null, "mode": "time", "name": null, "show": true, "values": [] }, "yaxes": [ { "decimals": 0, "format": "dtdurations", "label": null, "logBase": 1, "max": null, "min": null, "show": true }, { "format": "short", "label": null, "logBase": 1, "max": null, "min": null, "show": true } ], "yaxis": { "align": false, "alignLevel": null } }, { "aliasColors": {}, "bars": false, "dashLength": 10, "dashes": false, "datasource": "${DS_DEV_PROMETHEUS}", "decimals": null, "fill": 1, "gridPos": { "h": 7, "w": 6, "x": 6, "y": 25 }, "id": 40, "legend": { "alignAsTable": false, "avg": false, "current": true, "hideEmpty": false, "max": false, "min": false, "rightSide": false, "show": true, "total": false, "values": true }, "lines": true, "linewidth": 1, "links": [], "nullPointMode": "null", "paceLength": 10, "percentage": false, "pointradius": 2, "points": false, "renderer": "flot", "seriesOverrides": [], "stack": false, "steppedLine": false, "targets": [ { "expr": "pg_stat_database_tup_updated{instance="$database",datname!~"postgres|template0|template1"}", "format": "time_series", "intervalFactor": 1, "legendFormat": "{{datname}}", "refId": "A" } ], "thresholds": [], "timeFrom": null, "timeRegions": [], "timeShift": null, "title": "Tuple Updated", "tooltip": { "shared": true, "sort": 0, "value_type": "individual" }, "type": "graph", "xaxis": { "buckets": null, "mode": "time", "name": null, "show": true, "values": [] }, "yaxes": [ { "decimals": 0, "format": "bytes", "label": null, "logBase": 1, "max": null, "min": null, "show": true }, { "format": "short", "label": null, "logBase": 1, "max": null, "min": null, "show": true } ], "yaxis": { "align": false, "alignLevel": null } }, { "aliasColors": {}, "bars": false, "dashLength": 10, "dashes": false, "datasource": "${DS_DEV_PROMETHEUS}", "decimals": null, "fill": 1, "gridPos": { "h": 7, "w": 6, "x": 12, "y": 25 }, "id": 41, "legend": { "alignAsTable": false, "avg": false, "current": true, "hideEmpty": false, "max": false, "min": false, "rightSide": false, "show": true, "total": false, "values": true }, "lines": true, "linewidth": 1, "links": [], "nullPointMode": "null", "paceLength": 10, "percentage": false, "pointradius": 2, "points": false, "renderer": "flot", "seriesOverrides": [], "stack": false, "steppedLine": false, "targets": [ { "expr": "pg_stat_database_tup_deleted{instance="$database",datname!~"postgres|template0|template1"}", "format": "time_series", "intervalFactor": 1, "legendFormat": "{{datname}}", "refId": "A" } ], "thresholds": [], "timeFrom": null, "timeRegions": [], "timeShift": null, "title": "Tuple Deleted", "tooltip": { "shared": true, "sort": 0, "value_type": "individual" }, "type": "graph", "xaxis": { "buckets": null, "mode": "time", "name": null, "show": true, "values": [] }, "yaxes": [ { "decimals": 0, "format": "bytes", "label": null, "logBase": 1, "max": null, "min": null, "show": true }, { "format": "short", "label": null, "logBase": 1, "max": null, "min": null, "show": true } ], "yaxis": { "align": false, "alignLevel": null } }, { "aliasColors": {}, "bars": false, "dashLength": 10, "dashes": false, "datasource": "${DS_DEV_PROMETHEUS}", "decimals": null, "fill": 1, "gridPos": { "h": 7, "w": 6, "x": 18, "y": 25 }, "id": 42, "legend": { "alignAsTable": false, "avg": false, "current": true, "hideEmpty": false, "max": false, "min": false, "rightSide": false, "show": true, "total": false, "values": true }, "lines": true, "linewidth": 1, "links": [], "nullPointMode": "null", "paceLength": 10, "percentage": false, "pointradius": 2, "points": false, "renderer": "flot", "seriesOverrides": [], "stack": false, "steppedLine": false, "targets": [ { "expr": "pg_stat_database_tup_inserted{instance="$database",datname!~"postgres|template0|template1"}", "format": "time_series", "intervalFactor": 1, "legendFormat": "{{datname}}", "refId": "A" } ], "thresholds": [], "timeFrom": null, "timeRegions": [], "timeShift": null, "title": "Tuple Inserted", "tooltip": { "shared": true, "sort": 0, "value_type": "individual" }, "type": "graph", "xaxis": { "buckets": null, "mode": "time", "name": null, "show": true, "values": [] }, "yaxes": [ { "decimals": 0, "format": "bytes", "label": null, "logBase": 1, "max": null, "min": null, "show": true }, { "format": "short", "label": null, "logBase": 1, "max": null, "min": null, "show": true } ], "yaxis": { "align": false, "alignLevel": null } }, { "aliasColors": {}, "bars": false, "dashLength": 10, "dashes": false, "datasource": "${DS_DEV_PROMETHEUS}", "decimals": null, "fill": 1, "gridPos": { "h": 8, "w": 12, "x": 0, "y": 32 }, "id": 43, "legend": { "alignAsTable": false, "avg": false, "current": true, "hideEmpty": false, "max": false, "min": false, "rightSide": false, "show": true, "total": false, "values": true }, "lines": true, "linewidth": 1, "links": [], "nullPointMode": "null", "paceLength": 10, "percentage": false, "pointradius": 2, "points": false, "renderer": "flot", "seriesOverrides": [], "stack": false, "steppedLine": false, "targets": [ { "expr": "pg_stat_database_blks_hit{instance="$database",datname!~"postgres|template0|template1"}/(pg_stat_database_blks_read{instance="$database",datname!~"postgres|template0|template1"}+pg_stat_database_blks_hit{instance="$database",datname!~"postgres|template0|template1"})", "format": "time_series", "intervalFactor": 1, "legendFormat": "{{datname}}", "refId": "A" } ], "thresholds": [], "timeFrom": null, "timeRegions": [], "timeShift": null, "title": "Cache Hit Rate", "tooltip": { "shared": true, "sort": 0, "value_type": "individual" }, "type": "graph", "xaxis": { "buckets": null, "mode": "time", "name": null, "show": true, "values": [] }, "yaxes": [ { "decimals": 0, "format": "percentunit", "label": null, "logBase": 1, "max": null, "min": null, "show": true }, { "format": "short", "label": null, "logBase": 1, "max": null, "min": null, "show": true } ], "yaxis": { "align": false, "alignLevel": null } }, { "aliasColors": {}, "bars": false, "dashLength": 10, "dashes": false, "datasource": "${DS_DEV_PROMETHEUS}", "decimals": null, "fill": 1, "gridPos": { "h": 8, "w": 12, "x": 12, "y": 32 }, "id": 44, "legend": { "alignAsTable": false, "avg": true, "current": true, "hideEmpty": false, "max": false, "min": false, "rightSide": false, "show": true, "total": false, "values": true }, "lines": true, "linewidth": 1, "links": [], "nullPointMode": "null", "paceLength": 10, "percentage": false, "pointradius": 2, "points": false, "renderer": "flot", "seriesOverrides": [], "stack": false, "steppedLine": false, "targets": [ { "expr": "irate(pg_stat_bgwriter_checkpoint_sync_time{instance="$database"}[5m])", "format": "time_series", "intervalFactor": 1, "legendFormat": "checkpoint_sync_time", "refId": "A" }, { "expr": "irate(pg_stat_bgwriter_checkpoint_write_time{instance="$database"}[5m])", "format": "time_series", "intervalFactor": 1, "legendFormat": "checkpoint_write_time", "refId": "B" } ], "thresholds": [], "timeFrom": null, "timeRegions": [], "timeShift": null, "title": "Checkpoint Stats", "tooltip": { "shared": true, "sort": 0, "value_type": "individual" }, "type": "graph", "xaxis": { "buckets": null, "mode": "time", "name": null, "show": true, "values": [] }, "yaxes": [ { "decimals": 0, "format": "ms", "label": null, "logBase": 1, "max": null, "min": null, "show": true }, { "format": "short", "label": null, "logBase": 1, "max": null, "min": null, "show": true } ], "yaxis": { "align": false, "alignLevel": null } } ], "schemaVersion": 18, "style": "dark", "tags": [], "templating": { "list": [ { "allValue": null, "current": {}, "datasource": "${DS_DEV_PROMETHEUS}", "definition": "node_boot_time_seconds", "hide": 0, "includeAll": false, "label": "Server", "multi": false, "name": "server", "options": [], "query": "node_boot_time_seconds", "refresh": 1, "regex": "/.*instance="([^"]*).*/", "skipUrlSync": false, "sort": 0, "tagValuesQuery": "", "tags": [], "tagsQuery": "", "type": "query", "useTags": false }, { "allValue": null, "current": {}, "datasource": "${DS_DEV_PROMETHEUS}", "definition": "pg_static", "hide": 0, "includeAll": false, "label": "Database", "multi": false, "name": "database", "options": [], "query": "pg_static", "refresh": 1, "regex": "/.*instance="([^"]*).*/", "skipUrlSync": false, "sort": 0, "tagValuesQuery": "", "tags": [], "tagsQuery": "", "type": "query", "useTags": false } ] }, "time": { "from": "now-6h", "to": "now" }, "timepicker": { "refresh_intervals": [ "5s", "10s", "30s", "1m", "5m", "15m", "30m", "1h", "2h", "1d" ], "time_options": [ "5m", "15m", "1h", "6h", "12h", "24h", "2d", "7d", "30d" ] }, "timezone": "", "title": "PostgreSQL Database", "uid": "XfxdINqiz", "version": 56 }