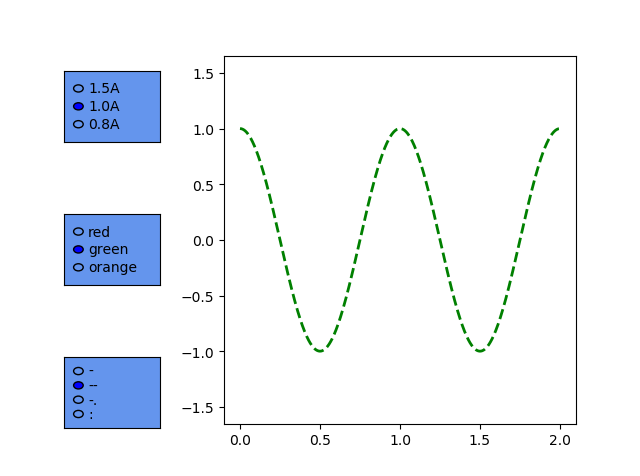
1. 类RadioButtons的使用方法
类似单选框
import numpy as np
import matplotlib.pyplot as plt
import matplotlib as mpl
from matplotlib.widgets import RadioButtons
mpl.use("Qt5Agg")

x = np.linspace(0.0, 2.0, 1000)
y1 = 1.5 * np.cos(2 * np.pi * x)
y2 = 1.0 * np.cos(2 * np.pi * x)
y3 = 0.8 * np.cos(2 * np.pi * x)

fig, ax = plt.subplots(1, 1)
line, = ax.plot(x, y1, color="red", lw=2)
plt.subplots_adjust(left=0.35)

facecolor = "cornflowerblue"

ax1 = plt.axes([0.1, 0.7, 0.15, 0.15], facecolor=facecolor)
radio1 = RadioButtons(ax1, ("1.5A", "1.0A", "0.8A"))


def amplitudefunc(label):
    hzdict = {"1.5A": y1, "1.0A": y2, "0.8A": y3}
    ydata = hzdict[label]
    line.set_ydata(ydata)
    plt.draw()


radio1.on_clicked(amplitudefunc)

ax2 = plt.axes([0.1, 0.4, 0.15, 0.15], facecolor=facecolor)
radio2 = RadioButtons(ax2, ("red", "green", "orange"))


def colorfunc(label):
    line.set_color(label)
    plt.draw()


radio2.on_clicked(colorfunc)

ax3 = plt.axes([0.1, 0.1, 0.15, 0.15], facecolor=facecolor)
radio3 = RadioButtons(ax3, ("-", "--", "-.", ":"))


def linestylefunc(label):
    line.set_linestyle(label)
    plt.draw()


radio3.on_clicked(linestylefunc)

plt.show()
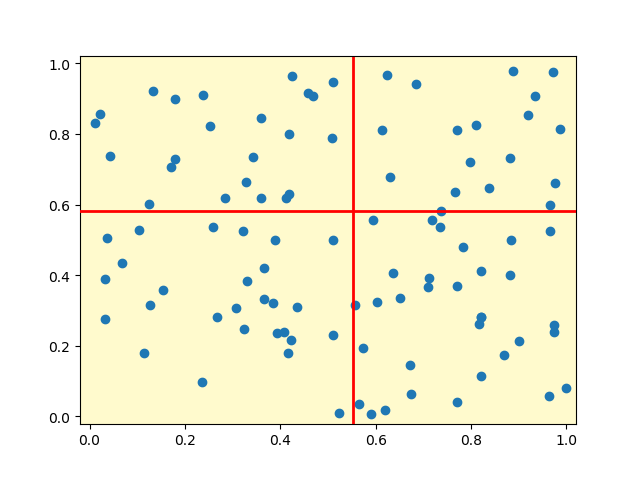
2. 类Cursor的使用方法
帮你聚焦鼠标所在位置
import numpy as np
import matplotlib.pyplot as plt
import matplotlib as mpl
from matplotlib.widgets import Cursor

lineprops = dict(color="red", lw=2)

fig, ax = plt.subplots(1, 1, subplot_kw=dict(facecolor="lemonchiffon"))

x = np.random.random(100)
y = np.random.random(100)
ax.scatter(x, y, marker="o")
ax.set_xlim(-0.02, 1.02)
ax.set_ylim(-0.02, 1.02)

cursor = Cursor(ax, useblit=True, **lineprops)  # 必须接收,不然会自动销毁掉。。。

plt.show()
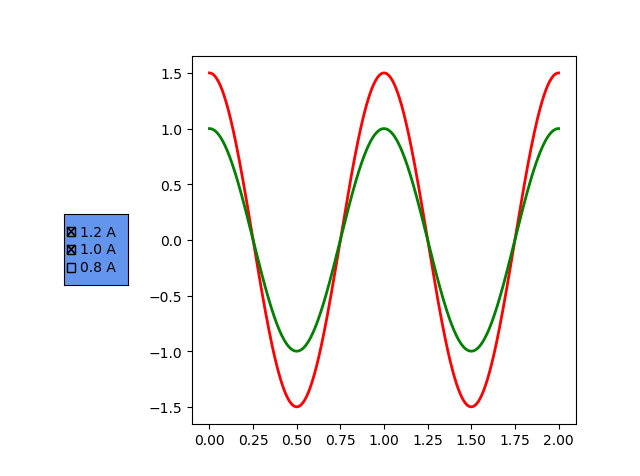
3. 类CheckButtons的使用方法
类似复选框
import numpy as np
import matplotlib.pyplot as plt
import matplotlib as mpl
from matplotlib.widgets import CheckButtons

x = np.linspace(0.0, 2.0, 1000)
y1 = 1.5 * np.cos(2 * np.pi * x)
y2 = 1.0 * np.cos(2 * np.pi * x)
y3 = 0.8 * np.cos(2 * np.pi * x)

fig, ax = plt.subplots(1, 1)
line1, = ax.plot(x, y1, color="red", lw=2, visible=False, label="1.2 A")
line2, = ax.plot(x, y2, color="green", lw=2, visible=False, label="1.0 A")
line3, = ax.plot(x, y3, color="orange", lw=2, visible=False, label="0.8 A")
plt.subplots_adjust(left=0.30)

facecolor = "cornflowerblue"

cax = plt.axes([0.1, 0.4, 0.1, 0.15], facecolor=facecolor)

lines = [line1, line2, line3]

labels = [str(line.get_label()) for line in lines]
visibility = [line.get_visible() for line in lines]
check = CheckButtons(cax, labels, visibility)


def func(label):
    index = labels.index(label)
    lines[index].set_visible(not lines[index].get_visible())
    plt.draw()


check.on_clicked(func)

plt.show()