apt-get install python-matplotlib

转载自:
http://www.cnblogs.com/qianlifeng/archive/2012/02/13/2350086.html
Basic:
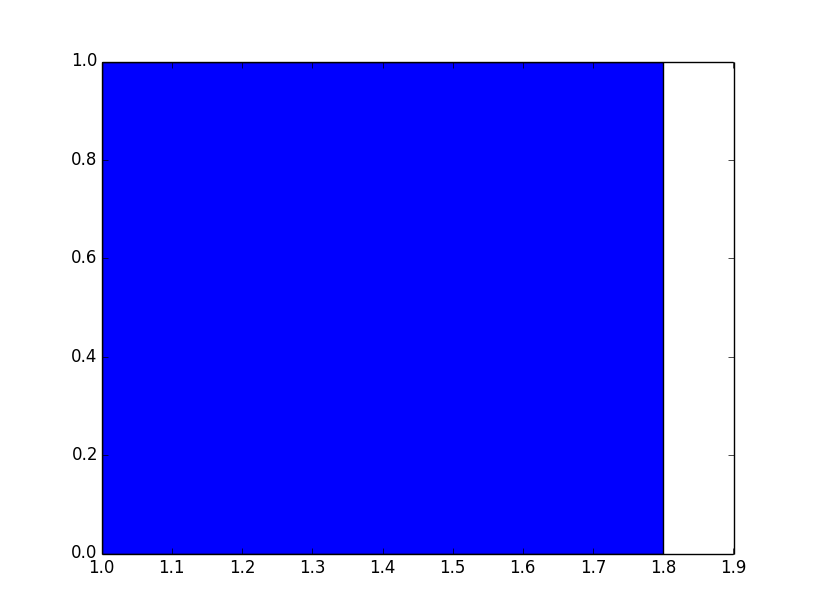
import matplotlib.pyplot as pyplot
pyplot.bar(left= 1, height= 1)
pyplot.show()
参数解释:
left:柱形的左边缘的位置,如果我们指定1,那么柱形的左边缘的x值就是1了
height:这是柱形的高度,也就是y轴的高度了。
双柱形图
__author__ = 'dell'
import matplotlib.pyplot as pyplot
pyplot.bar(left = [0, 1], height = [1, 0.5])
pyplot.show()
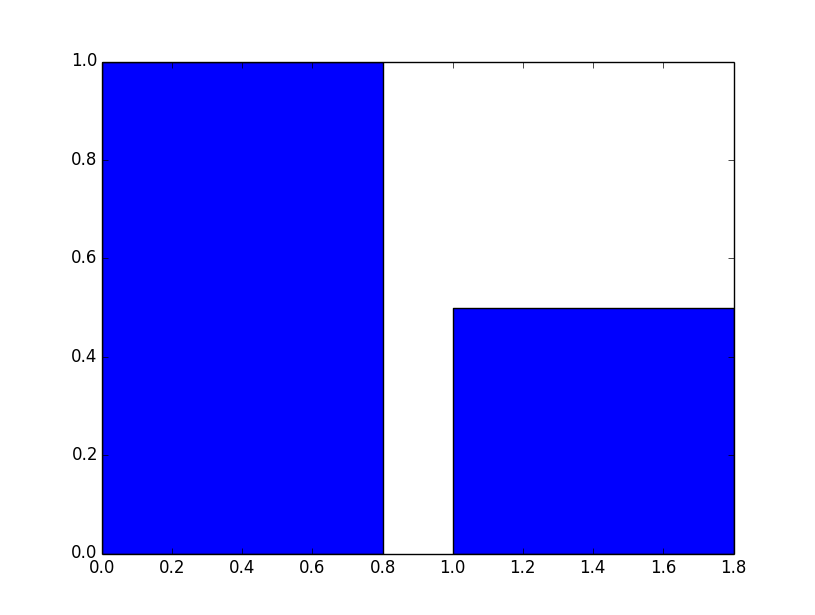
参数解释:
left = [0, 1] 表示两个柱形,第一个的左边缘是0,第二个的左边缘是1
height 参数同理。
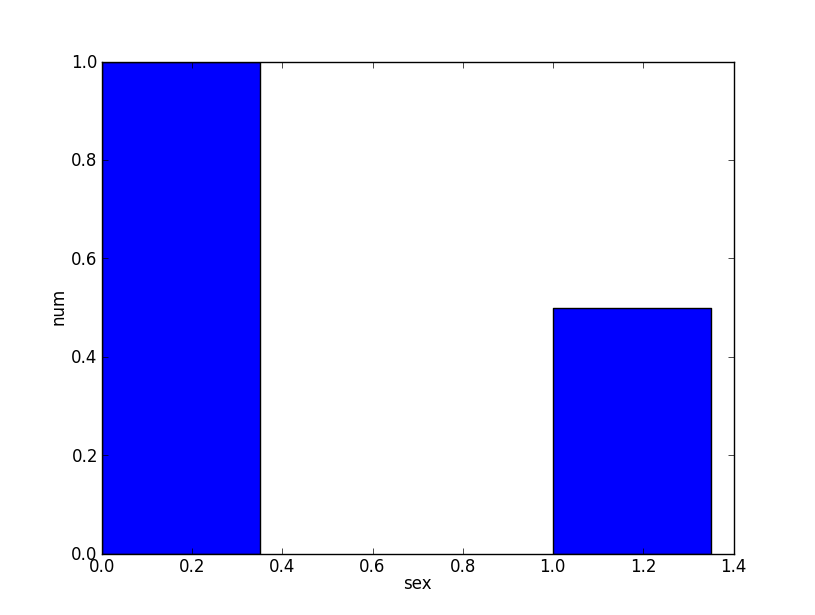
表明x轴是性别,y轴是数量
__author__ = 'dell'

import matplotlib.pyplot as pyplot

pyplot.xlabel('sex')
pyplot.ylabel('num')
pyplot.bar(left=[0, 1], height=[1, 0.5], width=0.35)
pyplot.show()