1、源码如下:
/**
* @Title:ColumnChart.java
* @Package:com.you.jfreechart
* @Description:柱形图
* @author:Youhaidong(游海东)
* @date:2013-7-23 下午10:50:00
* @version V1.0
*/
package com.you.jfreechart;
import java.awt.Color;
import java.awt.Font;
import org.jfree.chart.ChartFactory;
import org.jfree.chart.ChartFrame;
import org.jfree.chart.JFreeChart;
import org.jfree.chart.axis.CategoryAxis;
import org.jfree.chart.axis.CategoryLabelPositions;
import org.jfree.chart.plot.CategoryPlot;
import org.jfree.chart.plot.PlotOrientation;
import org.jfree.chart.title.LegendTitle;
import org.jfree.data.category.DefaultCategoryDataset;
/**
* 类功能说明
* 类修改者 修改日期
* 修改说明
* <p>Title:ColumnChart.java</p>
* <p>Description:游海东个人开发</p>
* <p>Copyright:Copyright(c)2013</p>
* @author:游海东
* @date:2013-7-23 下午10:50:00
* @version V1.0
*/
public class ColumnChart {
public ColumnChart(String string, JFreeChart chart) {
}
/**
* @Title:main
* @Description:柱形图
* @param:@param args
* @return: void
* @throws
*/
public static void main(String[] args) {
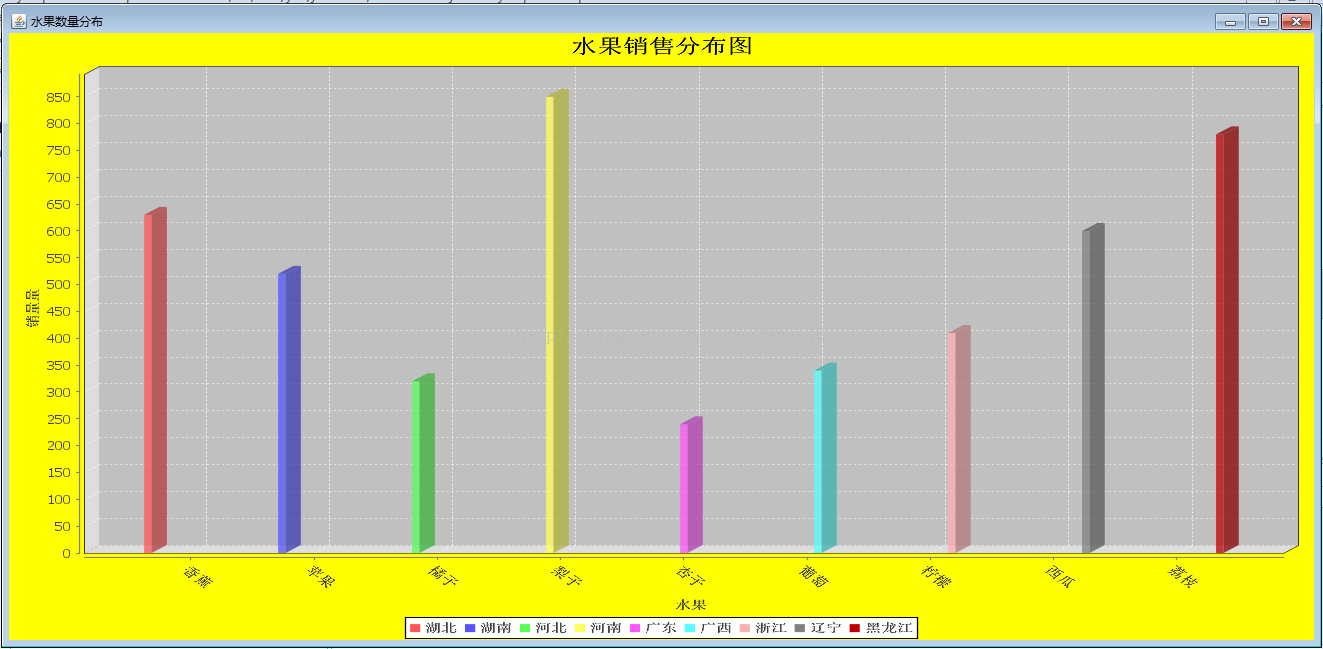
DefaultCategoryDataset dataset = new DefaultCategoryDataset();
dataset.addValue(630, "湖北", "香蕉");
dataset.addValue(520, "湖南", "苹果");
dataset.addValue(320, "河北", "橘子");
dataset.addValue(850, "河南", "梨子");
dataset.addValue(240, "广东", "杏子");
dataset.addValue(340, "广西", "葡萄");
dataset.addValue(410, "浙江", "柠檬");
dataset.addValue(600, "辽宁", "西瓜");
dataset.addValue(780, "黑龙江", "荔枝");
JFreeChart chart = ChartFactory.createBarChart3D("水果销售分布图","水果", "销量量", dataset,
PlotOrientation.VERTICAL, true, true, false);
chart.setBackgroundPaint(Color.yellow);
CategoryPlot categoryPlot = chart.getCategoryPlot();
categoryPlot.setBackgroundPaint(Color.LIGHT_GRAY);
categoryPlot.setDomainGridlinePaint(Color.white);
categoryPlot.setDomainGridlinesVisible(true);
categoryPlot.setRangeGridlinePaint(Color.white);
CategoryAxis categoryAxis = categoryPlot.getDomainAxis();
categoryAxis.setCategoryLabelPositions(CategoryLabelPositions.DOWN_45);
categoryPlot.getDomainAxis().setLabelFont(new Font("宋体",Font.BOLD,12));
categoryPlot.getRangeAxis().setLabelFont(new Font("宋体",Font.BOLD,12));
//解决标题乱码
chart.getTitle().setFont(new Font("宋体",Font.BOLD,20));
ChartFrame chartFrame = new ChartFrame("水果数量分布", chart);
chartFrame.pack();
chartFrame.setVisible(true);
//解决Legend乱码问题
LegendTitle legendTitle = chart.getLegend(0);
legendTitle.setItemFont(new Font("宋体",Font.BOLD,12));
}
}
2、生成结果如下,出现乱码:

3、解决中文乱码的源码
/**
 * @Title:ColumnChart.java
 * @Package:com.you.jfreechart
 * @Description:柱形图
 * @author:Youhaidong(游海东)
 * @date:2013-7-23 下午10:50:00
 * @version V1.0
 */
package com.you.jfreechart;

import java.awt.Color;
import java.awt.Font;
import org.jfree.chart.ChartFactory;
import org.jfree.chart.ChartFrame;
import org.jfree.chart.JFreeChart;
import org.jfree.chart.axis.CategoryAxis;
import org.jfree.chart.axis.CategoryLabelPositions;
import org.jfree.chart.plot.CategoryPlot;
import org.jfree.chart.plot.PlotOrientation;
import org.jfree.chart.title.LegendTitle;
import org.jfree.data.category.DefaultCategoryDataset;

/**
 * 类功能说明
 * 类修改者 修改日期
 * 修改说明
 * <p>Title:ColumnChart.java</p>
 * <p>Description:游海东个人开发</p>
 * <p>Copyright:Copyright(c)2013</p>
 * @author:游海东
 * @date:2013-7-23 下午10:50:00
 * @version V1.0
 */
public class ColumnChart {

	public ColumnChart(String string, JFreeChart chart) {

	}

	/**
	 * @Title:main
	 * @Description:柱形图
	 * @param:@param args
	 * @return: void
	 * @throws
	 */
	public static void main(String[] args) {

		DefaultCategoryDataset dataset = new DefaultCategoryDataset();
		dataset.addValue(630, "湖北", "香蕉");
		dataset.addValue(520, "湖南", "苹果");
		dataset.addValue(320, "河北", "橘子");
		dataset.addValue(850, "河南", "梨子");
		dataset.addValue(240, "广东", "杏子");
		dataset.addValue(340, "广西", "葡萄");
		dataset.addValue(410, "浙江", "柠檬");
		dataset.addValue(600, "辽宁", "西瓜");
		dataset.addValue(780, "黑龙江", "荔枝");

		JFreeChart chart = ChartFactory.createBarChart3D("水果销售分布图","水果", "销量量", dataset,
				           PlotOrientation.VERTICAL, true, true, false);
		chart.setBackgroundPaint(Color.yellow);
		CategoryPlot categoryPlot = chart.getCategoryPlot();
		categoryPlot.setBackgroundPaint(Color.LIGHT_GRAY);
		categoryPlot.setDomainGridlinePaint(Color.white);
		categoryPlot.setDomainGridlinesVisible(true);
		categoryPlot.setRangeGridlinePaint(Color.white);
		CategoryAxis categoryAxis = categoryPlot.getDomainAxis();
		categoryAxis.setCategoryLabelPositions(CategoryLabelPositions.DOWN_45);
		categoryAxis.setLabelFont(new Font("宋体",Font.BOLD,12));
		categoryAxis.setTickLabelFont(new Font("宋体",Font.BOLD,12));
		categoryPlot.getRangeAxis().setLabelFont(new Font("宋体",Font.BOLD,12));
		//解决标题乱码
		chart.getTitle().setFont(new Font("宋体",Font.BOLD,20));

		ChartFrame chartFrame = new ChartFrame("水果数量分布", chart);
		chartFrame.pack();
		chartFrame.setVisible(true);

		//解决Legend乱码问题
		LegendTitle legendTitle = chart.getLegend(0);
		legendTitle.setItemFont(new Font("宋体",Font.BOLD,12));

	}

}
4、显示结果如下图: