HighCharts之2D条状图
1、HighCharts之2D条状图源码
bar.html:
<!DOCTYPE html>
<html>
<head>
<meta charset="UTF-8">
<title>HighCharts 2D条状图</title>
<script type="text/javascript" src="../scripts/jquery-1.11.0.js"></script>
<script type="text/javascript" src="../scripts/js/highcharts.js"></script>
<script type="text/javascript">
$(function(){
$('#barChart').highcharts({
chart: {
type: 'bar'
},
title: {
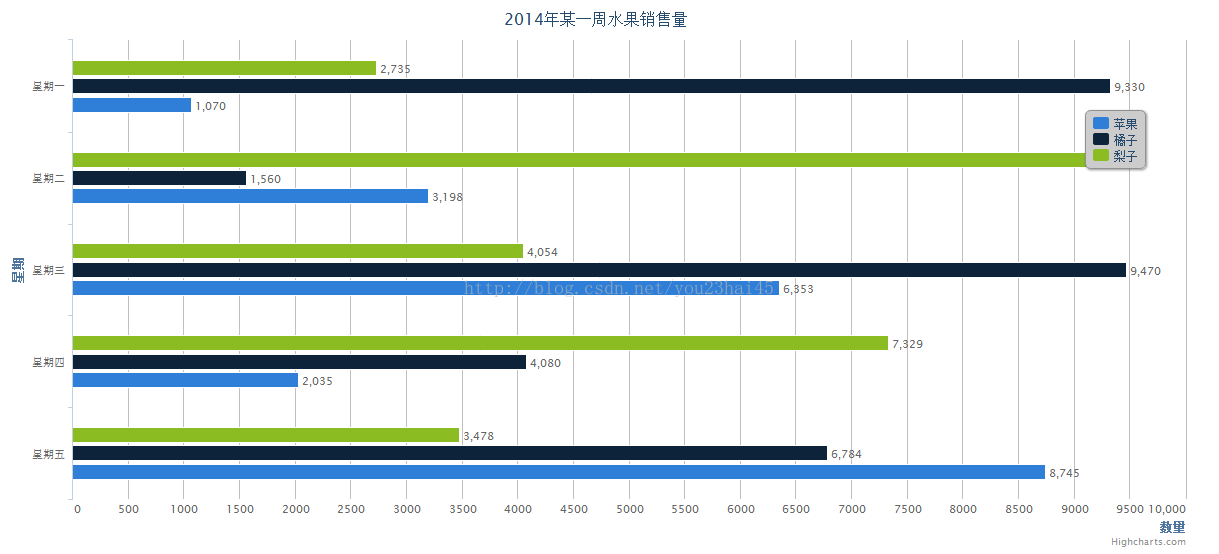
text: '2014年某一周水果销售量'
},
subtitle: {
text: ''
},
xAxis: {
categories: ['星期一', '星期二', '星期三', '星期四', '星期五','星期六','星期日'],
title: {
text: '星期'
}
},
yAxis: {
min: 0,
title: {
text: '数量',
align: 'high'
},
labels: {
overflow: 'justify'
}
},
tooltip: {
valueSuffix: ' kg'
},
plotOptions: {
bar: {
dataLabels: {
enabled: true
}
}
},
legend: {
layout: 'vertical',
align: 'right',
verticalAlign: 'top',
x: -40,
y: 100,
floating: true,
borderWidth: 1,
backgroundColor: '#CCCCCC',
shadow: true
},
credits: {
enabled: true
},
series: [{
name: '苹果',
data: [1070, 3198, 6353, 2035, 8745]
}, {
name: '橘子',
data: [9330, 1560, 9470, 4080, 6784]
}, {
name: '梨子',
data: [2735, 9140, 4054, 7329, 3478]
}]
});
});
</script>
</head>
<body>
<div id="barChart" style=" 1200px; height: 550px; margin: 0 auto"></div>
</body>
</html>2、运行结果