HighCharts之2D颜色阶梯饼图
1、实例源码
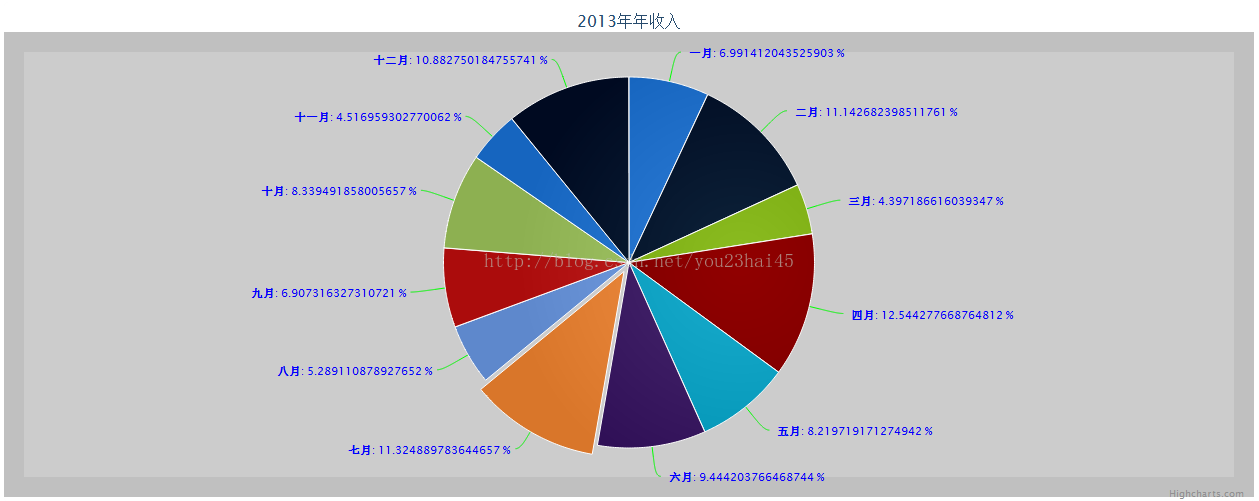
PieGradient.html:
<!DOCTYPE html>
<html>
<head>
<meta charset="UTF-8">
<title>HighCharts 2D颜色阶梯饼图</title>
<script type="text/javascript" src="../scripts/jquery-1.11.0.js"></script>
<script type="text/javascript" src="../scripts/js/highcharts.js"></script>
<script type="text/javascript">
     $(function(){
    	//
 		Highcharts.getOptions().colors = Highcharts.map(Highcharts.getOptions().colors, function(color) {
 		    return {
 		        radialGradient: { cx: 0.8, cy: 0.5, r: 0.6 },
 		        stops: [
 		            [0, color],
 		            [1, Highcharts.Color(color).brighten(-0.1).get('rgb')] // darken
 		        ]
 		    };
 		});

 		// 构建饼图
         $('#pieChart').highcharts({
             chart: {
                 plotBackgroundColor: '#CCCCCC',
                 plotBorderWidth: '20px',
                 plotShadow: true
             },
             title: {
                 text: '2013年年收入'
             },
             tooltip: {
         	    pointFormat: '{series.name}: <b>{point.percentage:.1f}%</b>'
             },
             plotOptions: {
                 pie: {
                     allowPointSelect: true,
                     cursor: 'pointer',
                     dataLabels: {
                         enabled: true,
                         color: '#0000FF',
                         connectorColor: '#00FF00',
                         formatter: function() {
                             return '<b>'+ this.point.name +'</b>: '+ this.percentage +' %';
                         }
                     }
                 }
             },
             series: [{
                 type: 'pie',
                 name: '收入比例',
                 data: [
                     ['一月', 5487],
                     ['二月', 8745],
                     ['三月', 3451],
                     ['四月', 9845],
                     ['五月', 6451],
                     ['六月', 7412],
                     {
                         name: '七月',
                         y: 8888,
                         sliced: true,
                         selected: true
                     },
                     ['八月', 4151],
                     ['九月', 5421],
                     ['十月', 6545],
                     ['十一月', 3545],
                     ['十二月', 8541]
                 ]
             }]
         });
     });
</script>
</head>
<body>
   <div id="pieChart" style=" 1250px; height: 500px; margin: 0 auto"></div>
</body>
</html>
2、实例结果