一实例
1 内存使用率
使⽤率 = 实际可⽤内存 / 总内存
node_memory_Buffers_bytes
可用内存
node_memory_MemAvailable_bytes
((node_memory_MemTotal_bytes - node_memory_MemFree_bytes - node_memory_Buffers_bytes - node_memory_Cached_bytes) / (node_memory_MemTotal_bytes )) * 100
2 硬盘io使用情况
((rate(node_disk_read_bytes_total[1m] )+ rate(node_disk_written_bytes_total[1m])) / 1024 /1024) > 0

硬盘使⽤率 是 read + written 读和写 都会占⽤IO /1024 两次后 就由 bytes => Mbs
3 硬盘使用情况
● node_filesystem_size_bytes
(总大小-剩余大小)/总大小=硬盘使用率
(node_filesystem_size_bytes {mountpoint ="/"} - node_filesystem_free_bytes {mountpoint ="/"}) /
node_filesystem_size_bytes {mountpoint ="/"} * 100
4 网卡流量
● node_network_transmit_bytes_total
irate(node_network_transmit_bytes_total{device!~"lo"}[1m]) / 1000
irate和rate都会用于计算某个指标在一定时间间隔内的变化速率。但是它们的计算方法有所不同:irate取的是在指定时间范围内的最近两个数据点来算速率,而rate会取指定时间范围内所有数据点,算出一组速率,然后取平均值作为结果
5 tcp连接数监控
数据来源: pushgateway + 脚本
脚本内容如下:
#!/bin/bash
instance_name=`hostname -f | cut -d'.' -f1` #本机机器名变量用于之后的标签
if [ $instance_name == "localhost" ];then
echo "Must FQDN hostname"
exit 1
fi
count_netstat_wait_connections=`netstat -an | grep -i wait | wc -l`
echo "count_netstat_wait_connections $count_netstat_wait_connections" | curl --data-binary @- http://192.168.1.211:9091/metrics/job/pushgateway/instance/$instance_name
然后设置crontab */1 * * * * bash /prometheus/pushgateway.sh
predict_linear() 函数 可以起到 对曲线变化速率的计算 以及在 ⼀段时间 加速度的未来预测
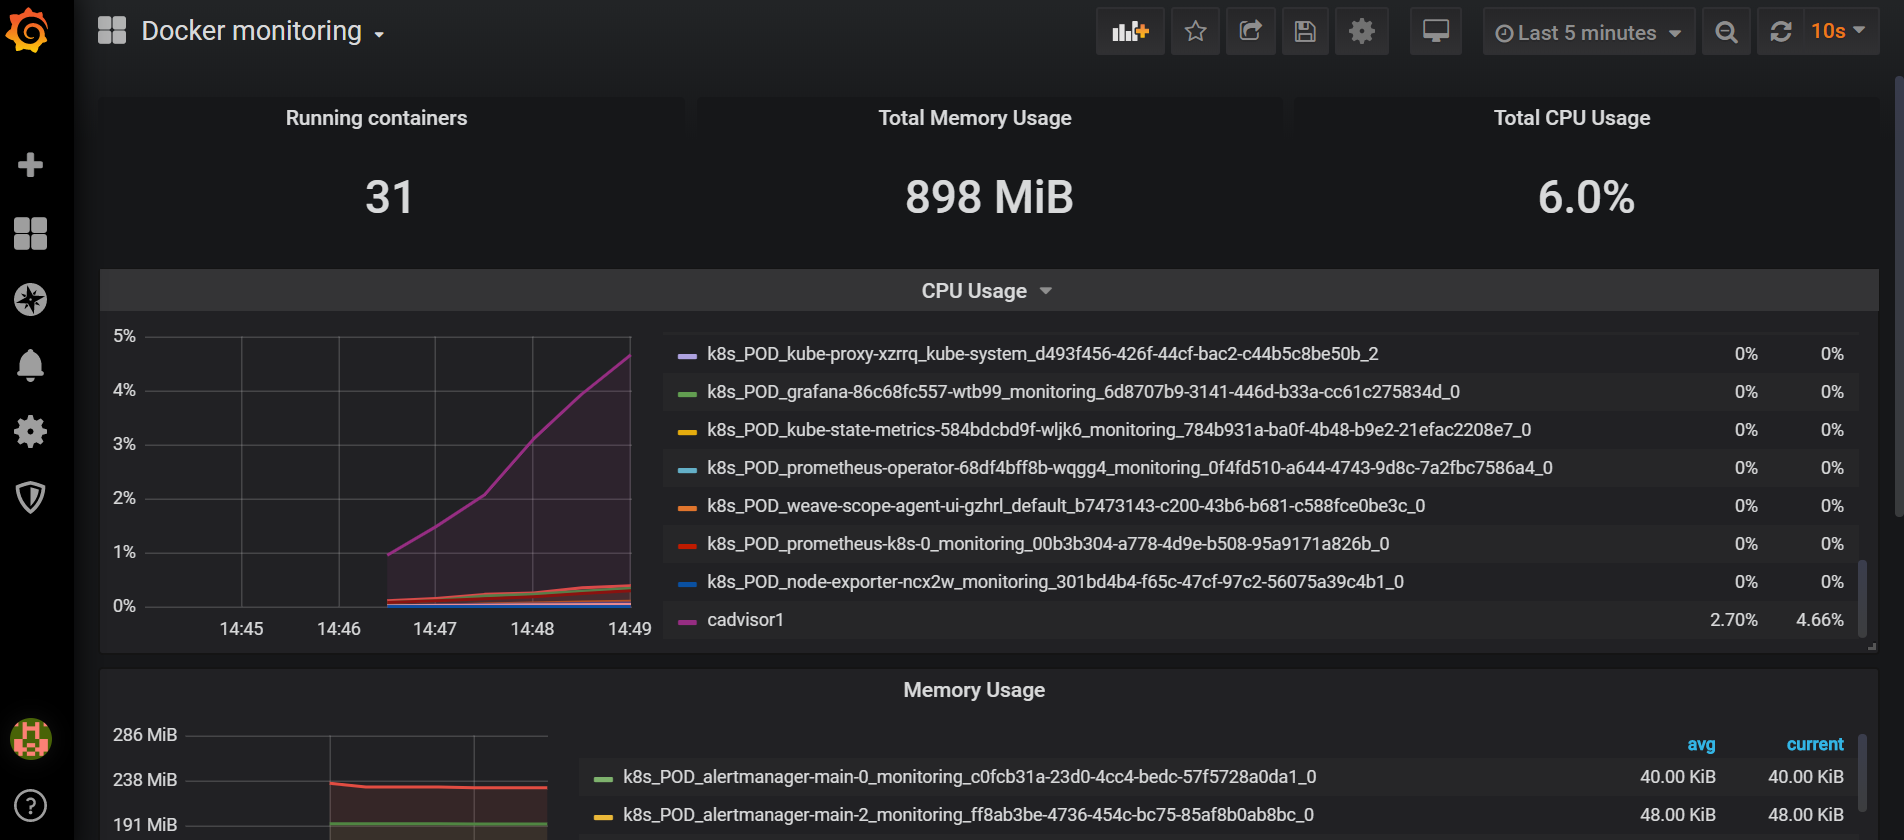
6 docker 容器监控
首先要安装Cadviosr,Cadviosr是Google用来监测单节点的资源信息的监控工具。虽然Docker提供了一些CLI的命令行的功能,但是在一个看图的时代,基本的功能是很难满足人民群众日益增长的物质文化需求,Cadvisor提供了一目了然的单节点多容器的资源监控功能。Google的Kubernetes中也缺省地将其作为单节点的资源监控工具,各个节点缺省会被安装上Cadvisor。在免费的世界里,Cadvisor作为一个很不错的工具,越来越多的引起很多人过渡性的关注。
6.1 拉取镜像
docker pull docker.io/google/cadvisor
6.2 运行一个cadvisor容器,并配置
docker run -d --volume=/:/rootfs:ro --volume=/var/run:/var/run:rw --volume=/sys:/sys:ro --volume=/var/lib/docker/:/var/lib/docker:ro --publish=8080:8080 --detach=true --name=cadvisor1 --net=host -v "/etc/localtime:/etc/localtime" google/cadvisor:latest
这里我们使用了 --net=host,这样 Prometheus Server 可以直接与 Exporter 和 Grafana 通信。
6.3 打开网页查看
localhost:8080/containers/
6.4 更改prometheus配置文件
 - job_name: 'docker'
    static_configs:
    - targets: ['192.168.1.211:8080']
然后重启prometheus服务
最后出图成功
7 监控cpu
● node_cpu_seconds_total
cpu情况
查看cpu使用空闲情况
(1-((sum(increase(node_cpu_seconds_total{mode="idle"}[1m])) by (instance))/(sum(increase(node_cpu_seconds_total[1m])) by (instance)))) * 100
cpu分别在1分钟,3分钟,5分钟之内的使用情况:
node_load1 / count by(job, instance)(count by(job, instance, cpu)(node_cpu_seconds_total))

node_load3 / count by(job, instance)(count by(job, instance, cpu)(node_cpu_seconds_total))

node_load5 / count by(job, instance)(count by(job, instance, cpu)(node_cpu_seconds_total))
二 监控模板
https://grafana.com/grafana/dashboards/8919 linux系统监控
https://grafana.com/grafana/dashboards/9276 linux主机监控中文
https://grafana.com/grafana/dashboards/193 docker容器模板
https://grafana.com/grafana/dashboards/8588 k8s监控模板