echarts.js初步

相信不少开发者会遇到开发数据显示效果的情况,这种情况下echarts.js将成为我们非常好用的工具,下面就通过一个简单的demo来了解一下它吧

这是echarts.js的中文开发文档地址http://echarts.baidu.com/option.html#xAxis.nameTextStyle
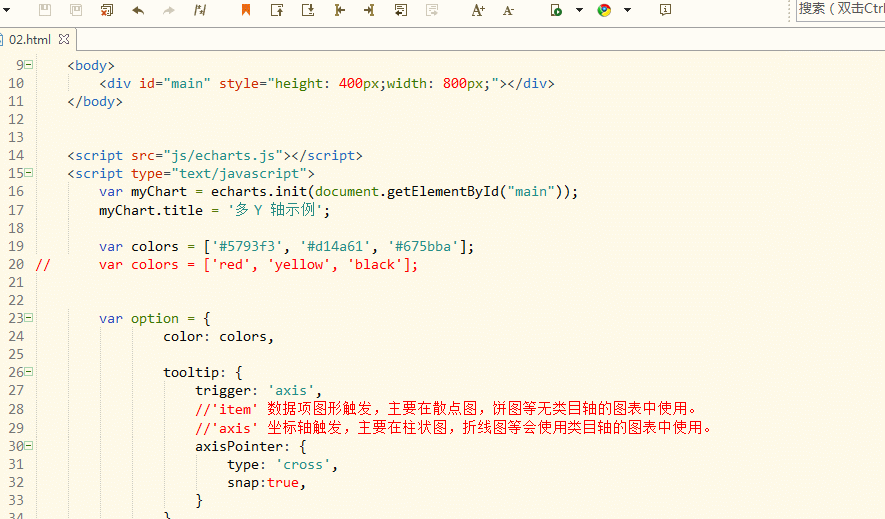
其运行代码大致如下

<body>
        <div id="main" style="height: 400px; 800px;"></div>
    </body>
    
    
    <script src="js/echarts.js"></script>
    <script type="text/javascript">
        var myChart = echarts.init(document.getElementById("main"));
        myChart.title = '多 Y 轴示例';

        var colors = ['#5793f3', '#d14a61', '#675bba'];
//        var colors = ['red', 'yellow', 'black'];
        
        
        var option = {
                color: colors,
            
                tooltip: {
                    trigger: 'axis',
                    //'item' 数据项图形触发,主要在散点图,饼图等无类目轴的图表中使用。
                    //'axis' 坐标轴触发,主要在柱状图,折线图等会使用类目轴的图表中使用。
                    axisPointer: {
                        type: 'cross',
                        snap:true,
                    }
                },
                grid: {
                    right: '20%' //设置grid 组件离容器右侧的距离。
                },
                legend: {
                    data:['蒸发量','降水量','平均温度']
                },
                xAxis: [
                    {
                        type: 'category',
                        axisTick: {
                            alignWithLabel: true,//可以保证刻度线和标签对齐
                        },
                        data: ['1月','2月','3月','4月','5月','6月','7月','8月','9月','10月','11月','12月']
                    }
                ],
                yAxis: [
                    {
                        type: 'value',
                        name: '蒸发量',
                        min: 0,
                        max: 250,
                        position: 'right',
                        axisLine: {
                            lineStyle: {
                                color: colors[0]//坐标轴颜色
                            }
                        },
                        axisLabel: {
                            formatter: '{value} ml'//坐标轴文字格式化
                        }
                    },
                    {
                        type: 'value',
                        name: '降水量',
                        min: 0,
                        max: 250,
                        position: 'right',//降水量的位置在右边,
                        offset: 80,//向右偏移
                        axisLine: {
                            lineStyle: {
                                color: colors[1]//坐标轴颜色
                            }
                        },
                        axisLabel: {
                            formatter: '{value} ml'
                        }
                    },
                    {
                        type: 'value',
                        name: '温度',
                        min: 0,
                        max: 25,
                        position: 'left',
                        axisLine: {
                            lineStyle: {
                                color: colors[2]
                            }
                        },
                        axisLabel: {
                            formatter: '{value} °C'
                        }
                    }
                ],
                series: [
                    {
                        name:'蒸发量',
                        type:'bar',
                        barCategoryGap:'50%',
                        data:[2.0, 4.9, 7.0, 23.2, 25.6, 76.7, 135.6, 162.2, 32.6, 20.0, 6.4, 3.3],
                    },
                    {
                        name:'降水量',
                        type:'bar',
                        yAxisIndex: 1,
                        data:[2.6, 5.9, 9.0, 26.4, 28.7, 70.7, 175.6, 182.2, 48.7, 18.8, 6.0, 2.3]
                    },
                    {
                        name:'平均温度',
                        type:'line',
                        yAxisIndex: 2,
                        data:[2.0, 2.2, 3.3, 4.5, 6.3, 10.2, 20.3, 23.4, 23.0, 16.5, 12.0, 6.2]
                    }
                ]
            };

        
        myChart.setOption(option);
    </script>

效果如下

怎么样,效果不错吧,这只是一个简单的demo,欢迎大神交流沟通哈

原文地址:https://www.cnblogs.com/huixin520/p/7143522.html