目录
一、The installing of matplotlib
- matplotlib is matrix plotting library.
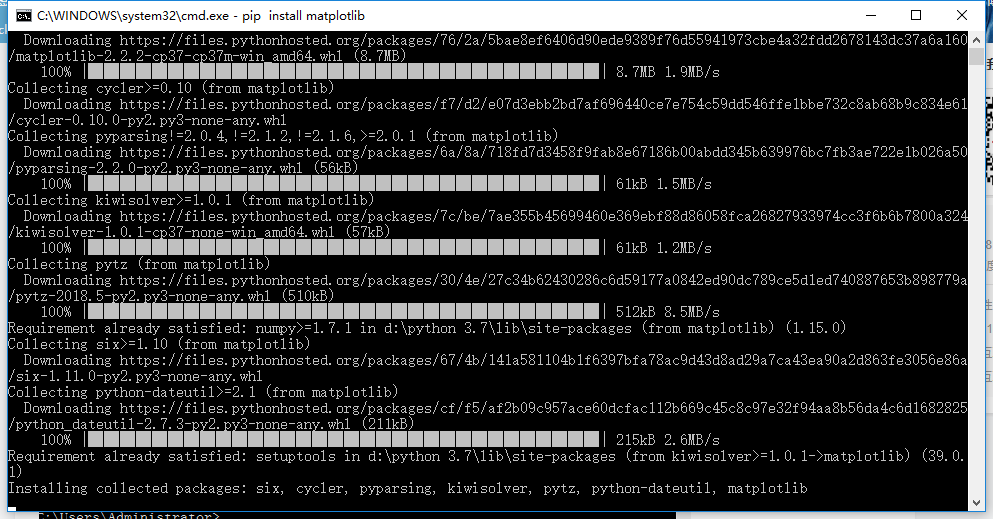
pip installing matlotlib
二、The Result Of Installing
The Unknown Word
| The First Column | The Second Column |
|---|---|
| matrix | 矩阵[metriks] |
| plotting | 测绘,标图 |
| plotting library | 绘图库 |
三、Histogram
The Numpy histogram function applied to an array returns a pair of vectors:the histogram of the array and the vector of bins.Beware:matloblib also has a function to build histogram.(called hist,as in Matlab)that differs from the one in NumPy.The main difference is that pylab.hist plots the histogram automatically,while numpy.histogram only generate the data.
import numpy as np
import matplotlib.pyplot as plt
# Build a vector of 10000 normal deviates with variance 0.5^2 and mean 2
mu, sigma = 2, 0.5
v = np.random.normal(mu,sigma,10000)
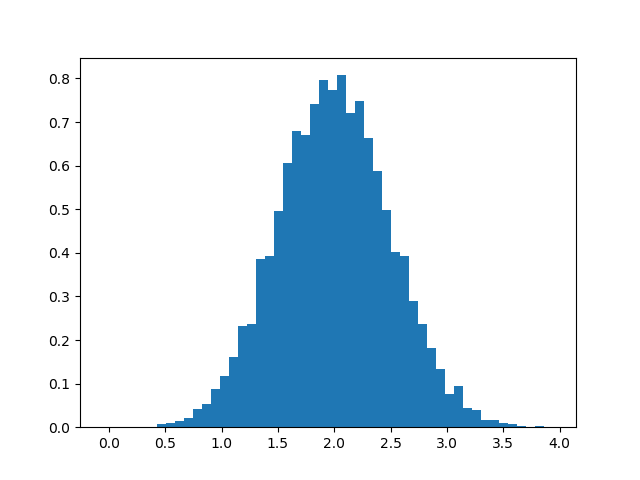
# Plot a normalized histogram with 50 bins
plt.hist(v, bins=50, density=1) # matplotlib version (plot)
plt.show()
The result of first section:
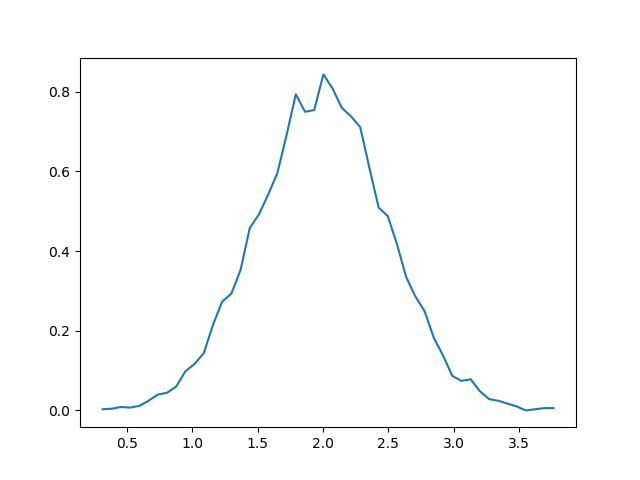
# Compute the histogram with numpy and then plot it
(n, bins) = np.histogram(v, bins=50, density=True)  # NumPy version (no plot)
plt.plot(.5*(bins[1:]+bins[:-1]), n)
plt.show()
The result of the second section: