1. 查看是否开启
show variables like 'profiling';
2. 开启功能
set profiling = on
3. 运行sql
#写的尽量耗时的sql,利于分析
select * from xxx group by id%20 order by 5;
#show profile 会记录这条sql
4. 查询结果
show profiles
5. 诊断sql
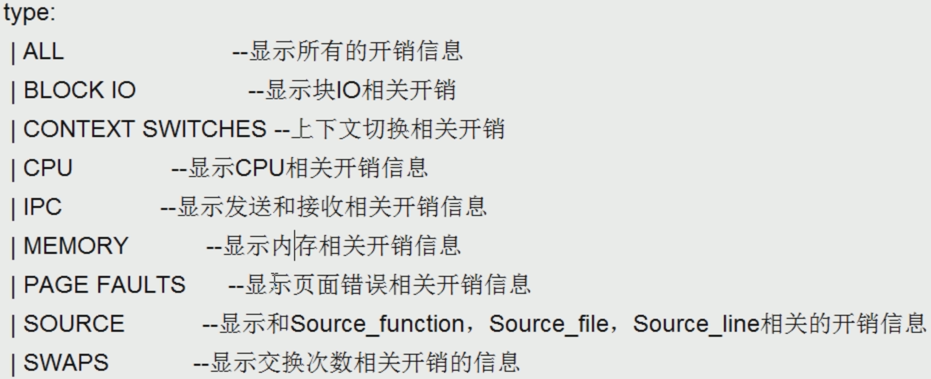
#cpu,block io 常用的两个参数
show profile cpu,block io for query sql的id; #上一步前面的问题sql的query_ID
6. 要注意的结论
#如果出现以下4个结果,说明sql需要优化
converting HEAP to MyISAM #查询的结果太大,内存都不够用了网磁盘上搬了。
Creating tmp table #创建临时表
Copying to tmp table on disk #把内存中的临时表复制到磁盘,危险!!!
locked #被锁

关注我的公众号,精彩内容不能错过