G2( bizCharts ) React 绘制混合图例,
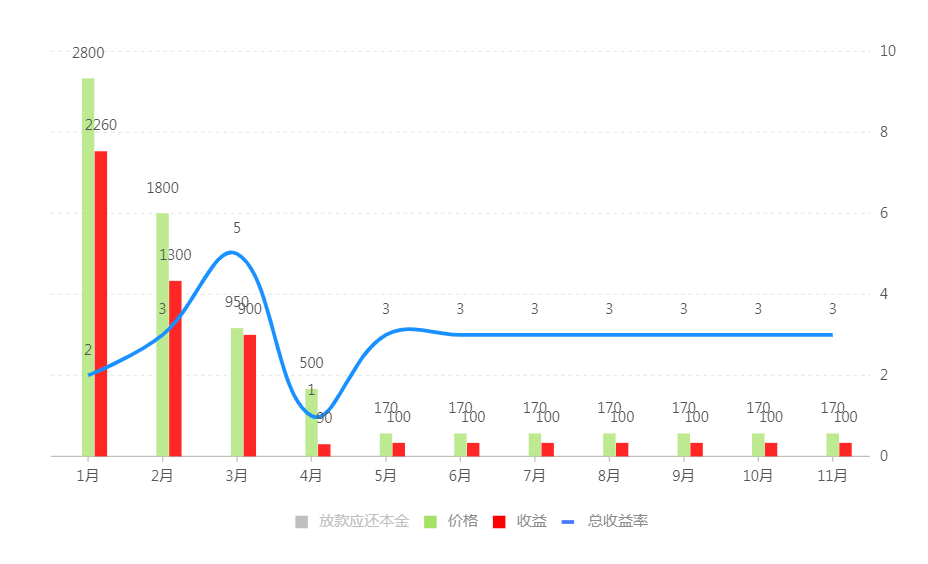
// data-set 可以按需引入,除此之外不要引入别的包
import React from 'react';
import { Chart, Axis, Tooltip, Geom, Legend, Label } from 'bizcharts';
import DataSet from '@antv/data-set';

// 下面的代码会被作为 cdn script 注入 注释勿删
// CDN START
const data = [
  { label: '0.1', 放款应还本金: 2800, 价格: 2800, 收益: 2260, 总收益率: 2 },
  { label: '0.2', 放款应还本金: 1800, 价格: 1800, 收益: 1300, 总收益率: 3 },
  { label: '0.3', 放款应还本金: 950, 价格: 950, 收益: 900, 总收益率: 5 },
  { label: '0.4', 放款应还本金: 500, 价格: 500, 收益: -390, 总收益率: 1 },
  { label: '0.5', 放款应还本金: 170, 价格: 170, 收益: 100, 总收益率: 3 },
  { label: '0.6', 放款应还本金: 170, 价格: 170, 收益: 100, 总收益率: 3 },
  { label: '0.7', 放款应还本金: 170, 价格: 170, 收益: -100, 总收益率: 3 },
  { label: '0.8', 放款应还本金: 170, 价格: 170, 收益: 100, 总收益率: 3 },
  { label: '0.9', 放款应还本金: 170, 价格: 170, 收益: 100, 总收益率: 3 },
  { label: '1.0', 放款应还本金: 170, 价格: 170, 收益: 100, 总收益率: 3 },
  { label: '未评分', 放款应还本金: 170, 价格: 170, 收益: 100, 总收益率: 3 },
];
const ds = new DataSet();
const dv = ds.createView().source(data);
dv.transform({
  type: 'fold',
  fields: ['放款应还本金', '价格', '收益'], // 展开字段集
  key: 'type', // key字段
  value: 'value', // value字段
});
const scale = {
  总收益率: {
    type: 'linear',
    min: 0,
    max: 10,
  },
};

let chartIns = null;

const getG2Instance = chart => {
  chartIns = chart;
};
console.log(getG2Instance, 'getG2Instance');
class Demo extends React.Component {
  render() {
    return (
      <Chart
        height={400}
        width={500}
        forceFit
        data={dv}
        scale={scale}
        padding="auto"
        onGetG2Instance={getG2Instance}
      >
        <Legend
          custom
          allowAllCanceled
          items={[
            {
              value: '放款应还本金',
              marker: { symbol: 'square', fill: '#3182bd', radius: 5 },
            },
            {
              value: '价格',
              marker: { symbol: 'square', fill: '#41a2fc', radius: 5 },
            },
            {
              value: '收益',
              marker: { symbol: 'square', fill: '#54ca76', radius: 5 },
            },
            {
              value: '总收益率',
              marker: {
                symbol: 'hyphen',
                stroke: '#fad248',
                radius: 5,
                lineWidth: 3,
              },
            },
          ]}
          onClick={ev => {
            const item = ev.item;
            const value = item.value;
            const checked = ev.checked;
            const geoms = chartIns.getAllGeoms();
            console.log('geoms', geoms);
            for (let i = 0; i < geoms.length; i++) {
              const geom = geoms[i];
              if (geom.getYScale().field === value && value === '总收益率') {
                if (checked) {
                  geom.show();
                } else {
                  geom.hide();
                }
              } else if (
                geom.getYScale().field === 'value' &&
                value !== '总收益率'
              ) {
                geom.getShapes().map(shape => {
                  if (shape._cfg.origin._origin.type == value) {
                    shape._cfg.visible = !shape._cfg.visible;
                  }
                  shape.get('canvas').draw();
                  return shape;
                });
              }

              const g_shapes = geom.get('labelContainer');
              let labels = g_shapes._cfg.labelsGroup._cfg.children;
              labels.map(label => {
                if (checked) {
                  if (label._id.includes(value)) {
                    label._cfg.visible = true;
                  }
                } else {
                  if (label._id.includes(value)) {
                    label._cfg.visible = false;
                  }
                }
              });
            }
          }}
        />
        <Axis name="label" />
        <Axis name="value" position={'left'} />
        <Tooltip />
        <Geom
          type="interval"
          position="label*value"
          color={[
            'type',
            value => {
              if (value === '放款应还本金') {
                return '#2b6cbb';
              }
              if (value === '价格') {
                return '#41a2fc';
              }
              if (value === '收益') {
                return '#54ca76';
              }
            },
          ]}
          adjust={[
            {
              type: 'dodge',
              marginRatio: 1 / 32,
            },
          ]}
        >
          <Label content="value" />
        </Geom>
        <Geom type="line" position="label*总收益率" color="#fad248" size={3}>
          <Label content="label" />
        </Geom>
      </Chart>
    );
  }
}

// CDN END
ReactDOM.render(<Demo />, mountNode);