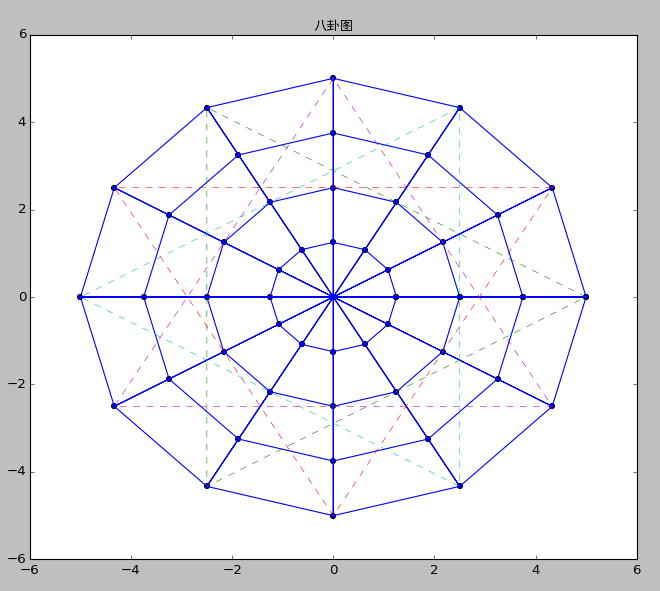
【效果图】
【源代码】
 1 import matplotlib.pyplot as plt
 2 import matplotlib.tri as tri
 3 import numpy as np
 4 import math
 5
 6
 7 n_angles = 12
 8 n_radii = 5
 9 min_radius = 0.0
10 radii = np.linspace(min_radius, 5.0, n_radii)
11
12 angles = np.linspace(0, 2*math.pi, n_angles, endpoint=False)
13
14 temp = []
15 for i in range(12):
16     temp.append(angles[i])
17 temp.append(angles[0])
18 angles = np.array(temp)
19
20 angles = np.repeat(angles[..., np.newaxis], n_radii, axis=1)
21 #angles[:, 1::2] += math.pi/n_angles
22
23 x = (radii*np.cos(angles))#.flatten()
24 y = (radii*np.sin(angles))#.flatten()
25
26 x1 = x.flatten()
27 y1 = y.flatten()
28
29
30 plt.figure()
31
32 # 点
33 plt.scatter(x, y)
34 # 环线
35 plt.plot(x, y, 'b')
36 # 直线
37 plt.plot(x1,y1)
38 # 三角线
39 for i in range(4):
40     print(i,i+4,i+8)
41     print(x.shape,y.shape)
42     tempx = []
43     tempx.append(x[i][4])
44     tempx.append(x[i+4][4])
45     tempx.append(x[i+8][4])
46     tempx.append(x[i][4])
47     tempy = []
48     tempy.append(y[i][4])
49     tempy.append(y[i+4][4])
50     tempy.append(y[i+8][4])
51     tempy.append(y[i][4])
52     x2 = np.array(tempx)
53     y2 = np.array(tempy)
54     print(x2.shape,y2.shape)
55     plt.plot(x2,y2,'--',lw=0.5)
56
57 plt.title('八卦图',fontproperties="SimHei")
58
59 plt.show()